

An RNA molecular switch: Intrinsic flexibility of 23S rRNA Helices 40 and 68 5'-UAA/5'-GAN internal loops studied by molecular dynamics methods
- PMID: 21132104
- PMCID: PMC2994019
An RNA molecular switch: Intrinsic flexibility of 23S rRNA Helices 40 and 68 5'-UAA/5'-GAN internal loops studied by molecular dynamics methods
Abstract
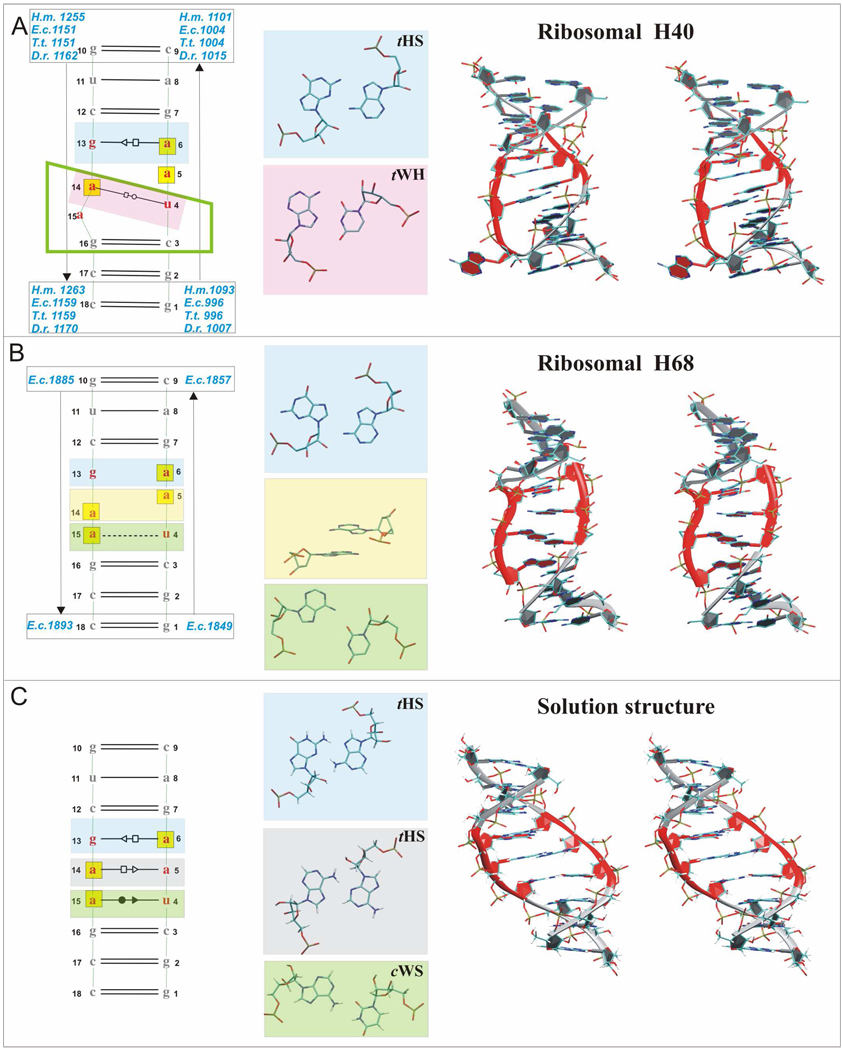
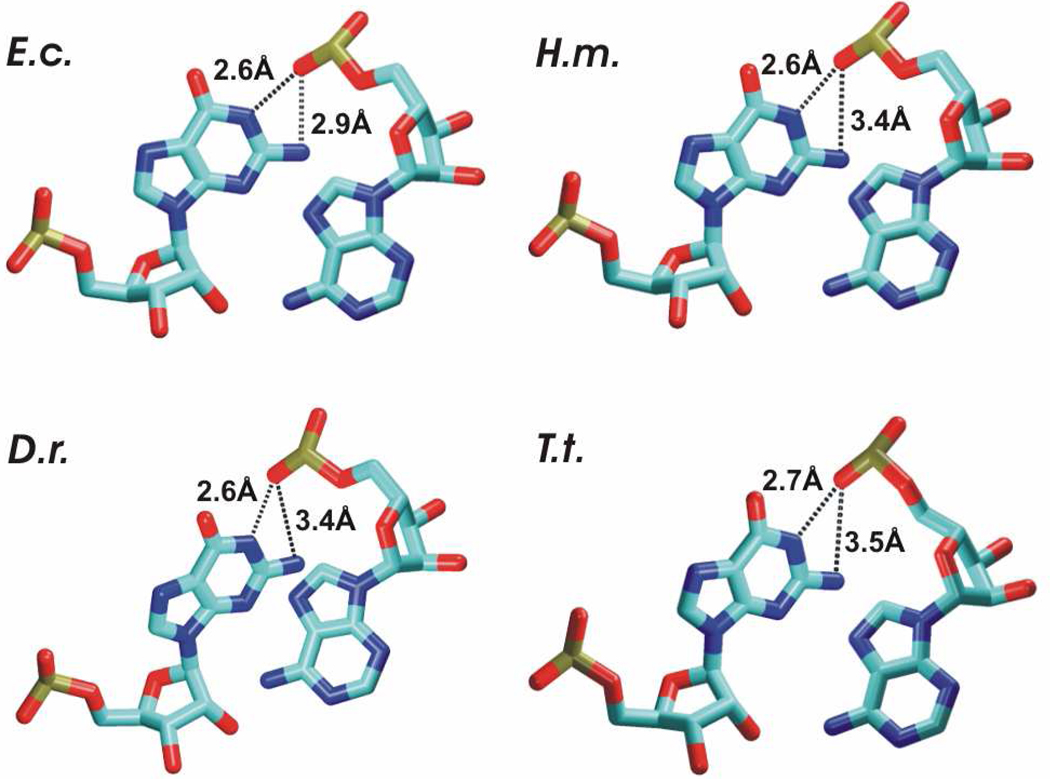
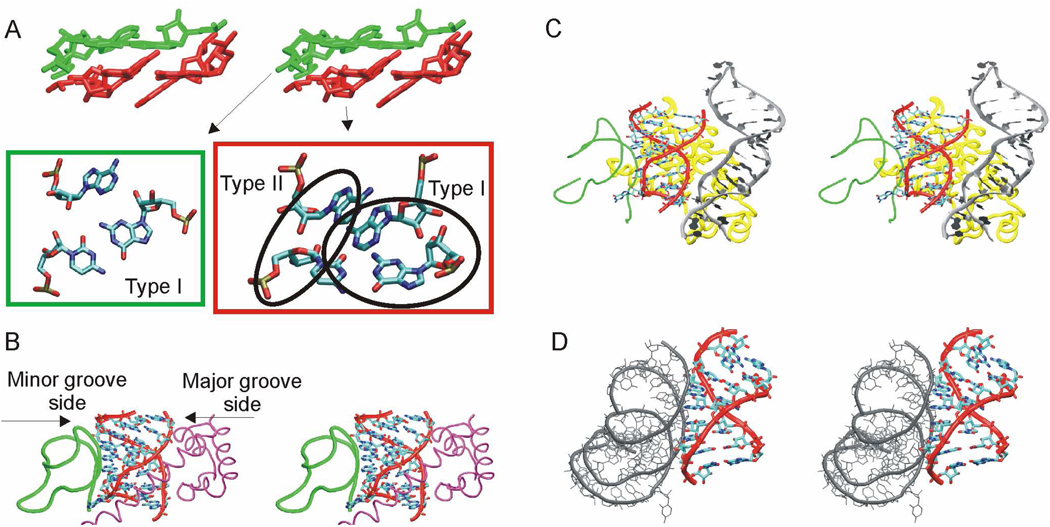
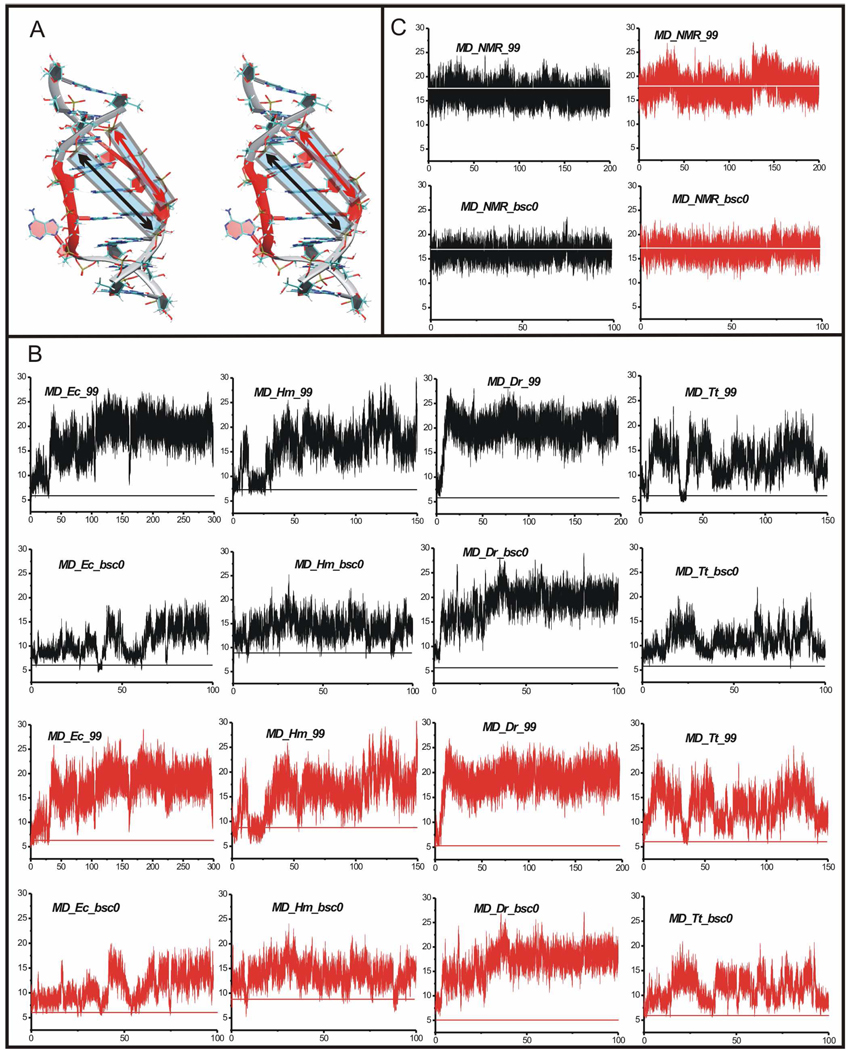
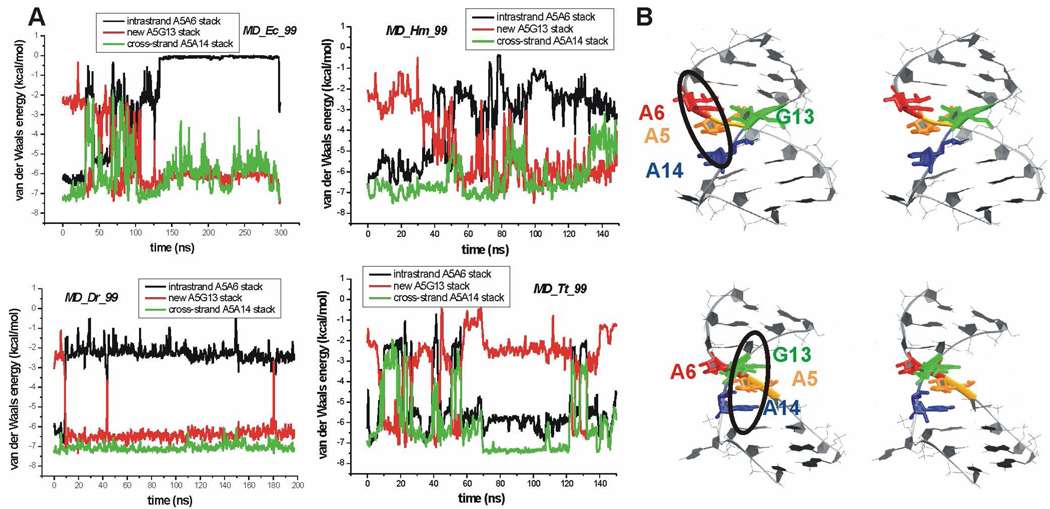
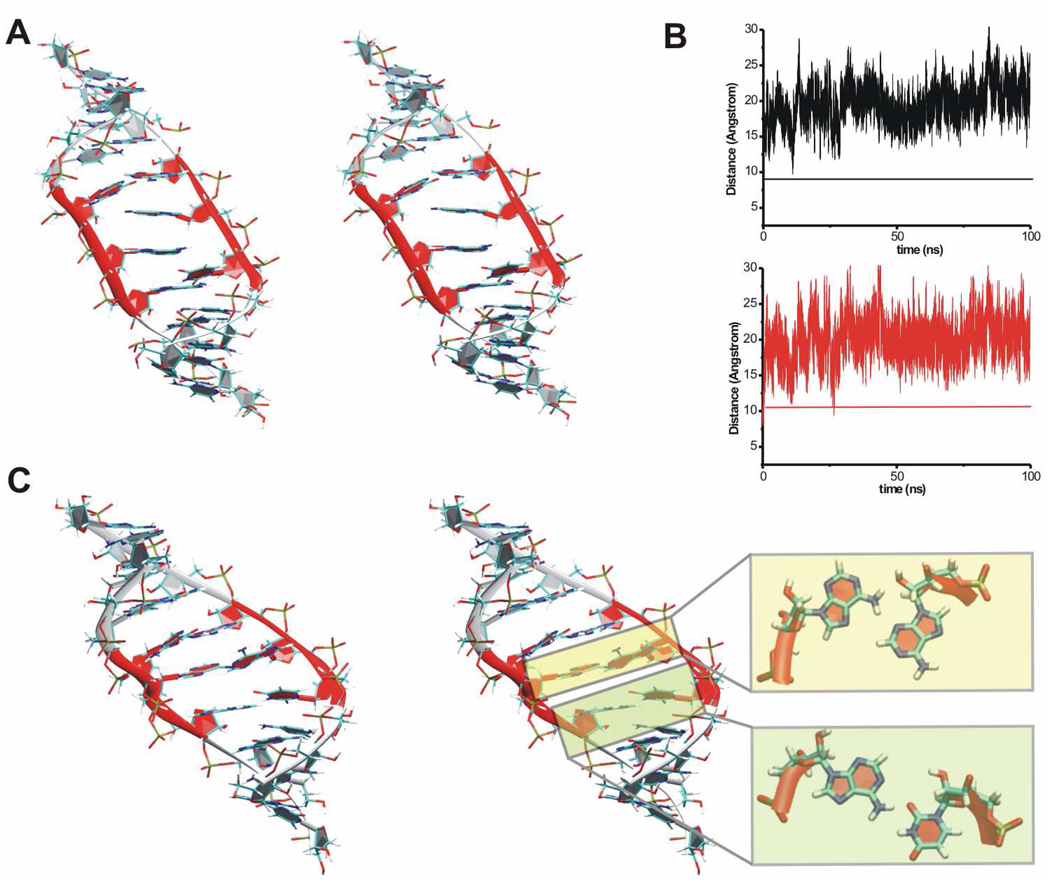
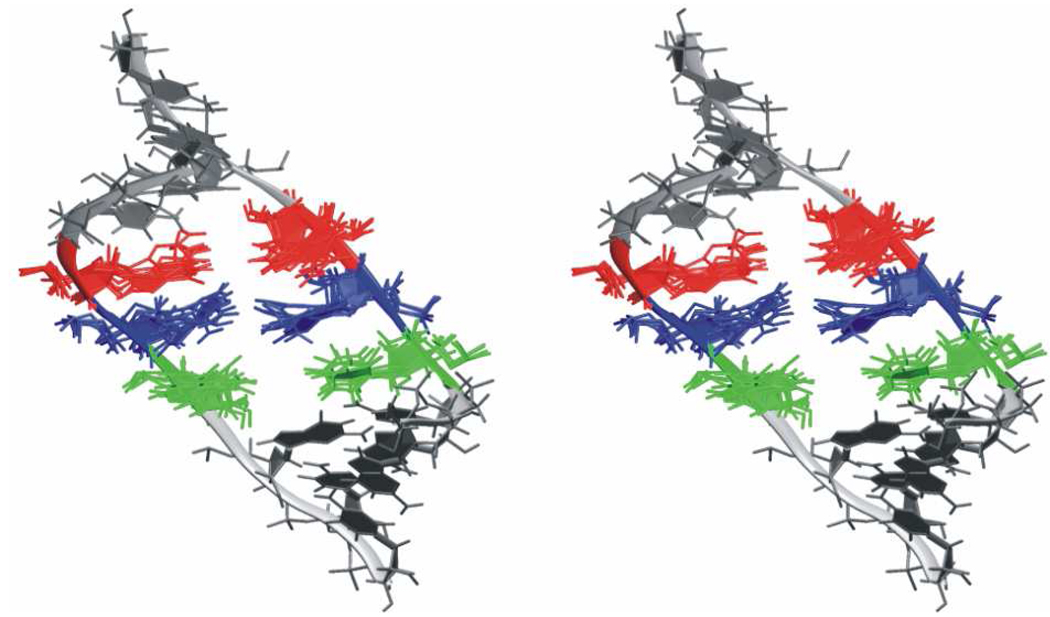
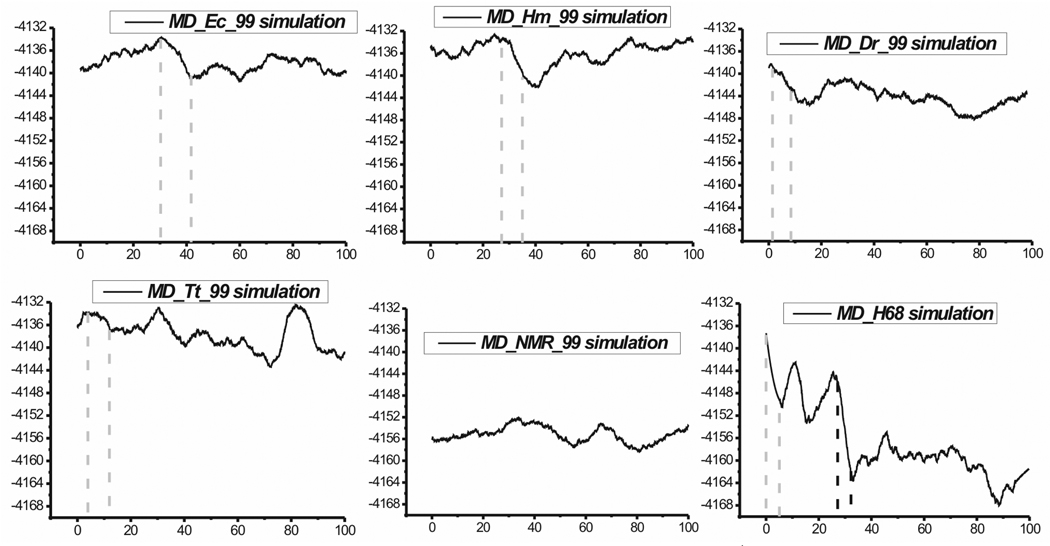
Functional RNA molecules such as ribosomal RNAs frequently contain highly conserved internal loops with a 5'-UAA/5'-GAN (UAA/GAN) consensus sequence. The UAA/GAN internal loops adopt distinctive structure inconsistent with secondary structure predictions. The structure has a narrow major groove and forms a trans Hoogsteen/Sugar edge (tHS) A/G base pair followed by an unpaired stacked adenine, a trans Watson-Crick/Hoogsteen (tWH) U/A base pair and finally by a bulged nucleotide (N). The structure is further stabilized by a three-adenine stack and base-phosphate interaction. In the ribosome, the UAA/GAN internal loops are involved in extensive tertiary contacts, mainly as donors of A-minor interactions. Further, this sequence can adopt an alternative 2D/3D pattern stabilized by a four-adenine stack involved in a smaller number of tertiary interactions. The solution structure of an isolated UAA/GAA internal loop shows substantially rearranged base pairing with three consecutive non-Watson-Crick base pairs. Its A/U base pair adopts an incomplete cis Watson-Crick/Sugar edge (cWS) A/U conformation instead of the expected Watson-Crick arrangement. We performed 3.1 µs of explicit solvent molecular dynamics (MD) simulations of the X-ray and NMR UAA/GAN structures, supplemented by MM-PBSA free energy calculations, locally enhanced sampling (LES) runs, targeted MD (TMD) and nudged elastic band (NEB) analysis. We compared parm99 and parmbsc0 force fields and net-neutralizing Na(+) vs. excess salt KCl ion environments. Both force fields provide a similar description of the simulated structures, with the parmbsc0 leading to modest narrowing of the major groove. The excess salt simulations also cause a similar effect. While the NMR structure is entirely stable in simulations, the simulated X-ray structure shows considerable widening of the major groove, loss of base-phosphate interaction and other instabilities. The alternative X-ray geometry even undergoes conformational transition towards the solution 2D structure. Free energy calculations confirm that the X-ray arrangement is less stable than the solution structure. LES, TMD and NEB provide a rather consistent pathway for interconversion between the X-ray and NMR structures. In simulations, the incomplete cWS A/U base pair of the NMR structure is water mediated and alternates with the canonical A-U base pair, which is not indicated by the NMR data. Completion of full cWS A/U base pair is prevented by the overall internal loop arrangement. In summary, the simulations confirm that the UAA/GAN internal loop is a molecular switch RNA module that adopts its functional geometry upon specific tertiary contexts.
Figures
Similar articles
-
An RNA Molecular Switch: Intrinsic Flexibility of 23S rRNA Helices 40 and 68 5'-UAA/5'-GAN Internal Loops Studied by Molecular Dynamics Methods.J Chem Theory Comput. 2010 Mar 9;6(3):910-29. doi: 10.1021/ct900440t. J Chem Theory Comput. 2010. PMID: 26613316
-
The NMR structure of an internal loop from 23S ribosomal RNA differs from its structure in crystals of 50s ribosomal subunits.Biochemistry. 2006 Oct 3;45(39):11776-89. doi: 10.1021/bi0605787. Biochemistry. 2006. PMID: 17002278 Free PMC article.
-
A-minor tertiary interactions in RNA kink-turns. Molecular dynamics and quantum chemical analysis.J Phys Chem B. 2011 Dec 1;115(47):13897-910. doi: 10.1021/jp2065584. Epub 2011 Nov 7. J Phys Chem B. 2011. PMID: 21999672
-
An innate twist between Crick's wobble and Watson-Crick base pairs.RNA. 2013 Aug;19(8):1038-53. doi: 10.1261/rna.036905.112. RNA. 2013. PMID: 23861536 Free PMC article. Review.
-
RNA structure and dynamics: a base pairing perspective.Prog Biophys Mol Biol. 2013 Nov;113(2):264-83. doi: 10.1016/j.pbiomolbio.2013.07.003. Epub 2013 Jul 23. Prog Biophys Mol Biol. 2013. PMID: 23891726 Review.
Cited by
-
Structure and mechanical properties of the ribosomal L1 stalk three-way junction.Nucleic Acids Res. 2012 Jul;40(13):6290-303. doi: 10.1093/nar/gks258. Epub 2012 Mar 26. Nucleic Acids Res. 2012. PMID: 22451682 Free PMC article.
-
The MM/PBSA and MM/GBSA methods to estimate ligand-binding affinities.Expert Opin Drug Discov. 2015 May;10(5):449-61. doi: 10.1517/17460441.2015.1032936. Epub 2015 Apr 2. Expert Opin Drug Discov. 2015. PMID: 25835573 Free PMC article. Review.
-
Physicochemically tunable polyfunctionalized RNA square architecture with fluorogenic and ribozymatic properties.ACS Nano. 2014 Aug 26;8(8):7620-9. doi: 10.1021/nn502160s. ACS Nano. 2014. PMID: 24971772 Free PMC article.
-
Higher order structural effects stabilizing the reverse Watson-Crick Guanine-Cytosine base pair in functional RNAs.Nucleic Acids Res. 2014 Jan;42(2):714-26. doi: 10.1093/nar/gkt800. Epub 2013 Oct 10. Nucleic Acids Res. 2014. PMID: 24121683 Free PMC article.
-
Molecular Mechanics Investigation of an Adenine-Adenine Non-Canonical Pair Conformational Change.J Chem Theory Comput. 2011 Nov 8;7(11):3779-3792. doi: 10.1021/ct200223q. J Chem Theory Comput. 2011. PMID: 22116780 Free PMC article.
References
-
- Ban N, Nissen P, Hansen J, Moore PB, Steitz TA. The complete atomic structure of the large ribosomal subunit at 2.4 A resolution. Science. 2000;289:905–920. - PubMed
-
- Harms JM, Schluenzen F, Zarivach R, Bashan A, Gat S, Agmon I, Bartels H, Franceschi F, Yonath A. High resolution structure of the large ribosomal subunit from a mesophilic eubacterium. Cell. 2001;107:679–688. - PubMed
-
- Wimberly BT, Brodersen DE, Clemons WMJ, Morgan-Warren RJ, Carter AP, Vonrhein C, Hartsch T, Ramakrishnan V. Structure of the 30S ribosomal subunit. Nature. 2000;407:327–339. - PubMed
-
- Leontis NB, Westhof E. Analysis of RNA motifs. Curr. Opin. Struct. Biol. 2003;13:300–308. - PubMed
-
- Lee JC, Gutell RR, Russell R. The UAA/GAN internal loop motif: A new RNA structural element that forms a cross-strand AAA stack and long-range tertiary interactions. J. Mol. Biol. 2006;360:978–988. - PubMed
Grants and funding
LinkOut - more resources
Full Text Sources
Miscellaneous