. 2010 Oct 26;43(20):8656-8663.
doi: 10.1021/ma1012978.

Saloplastic Macroporous Polyelectrolyte Complexes: Cartilage Mimics

Affiliations

Saloplastic Macroporous Polyelectrolyte Complexes: Cartilage Mimics

Haifa H Hariri et al. Macromolecules. .

Abstract

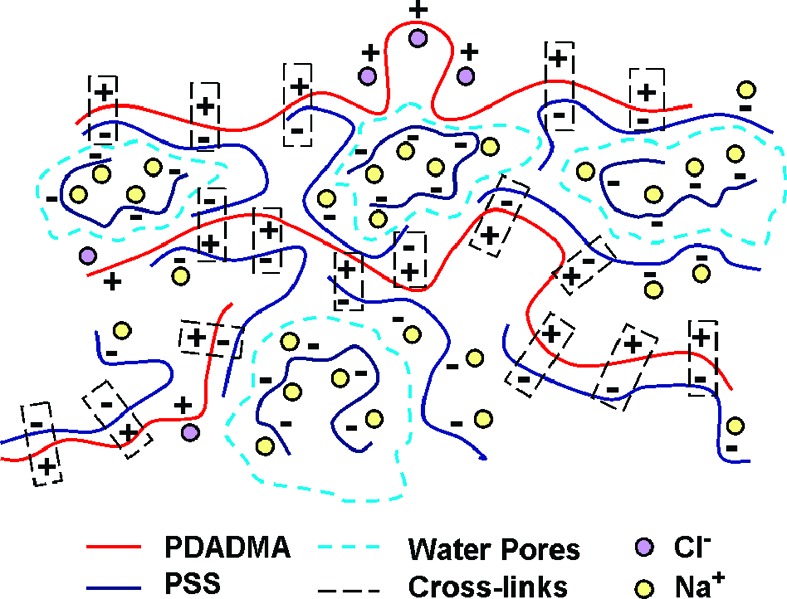
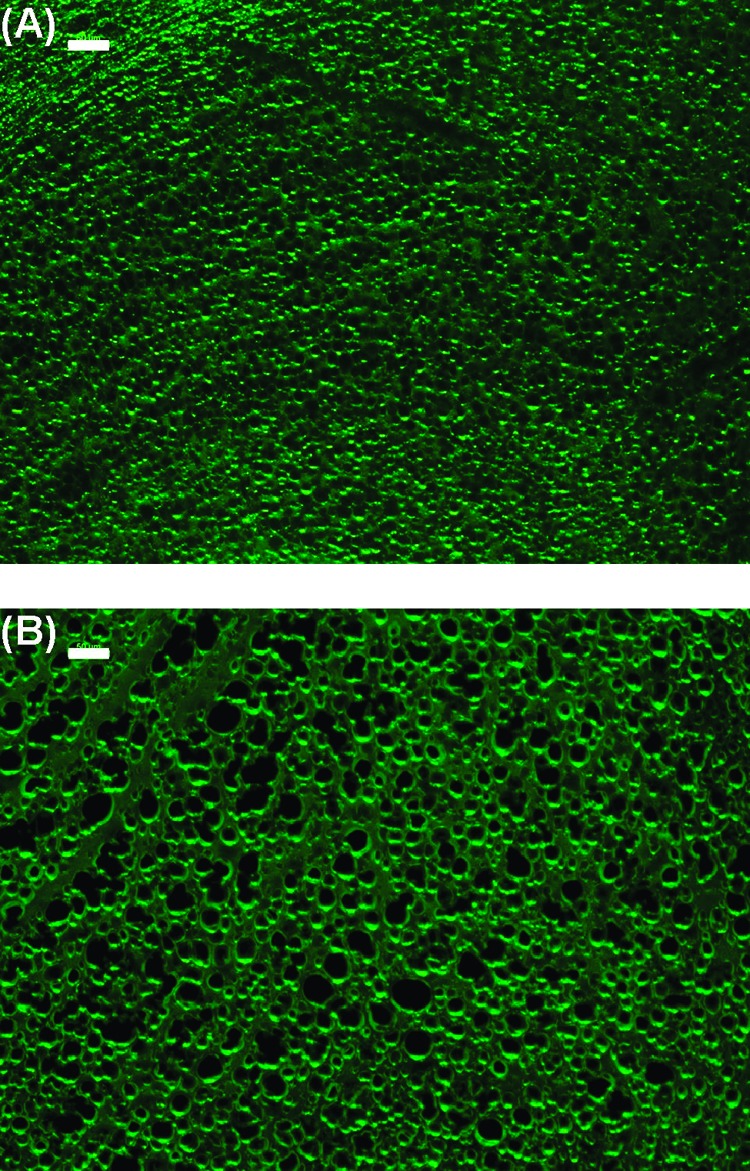
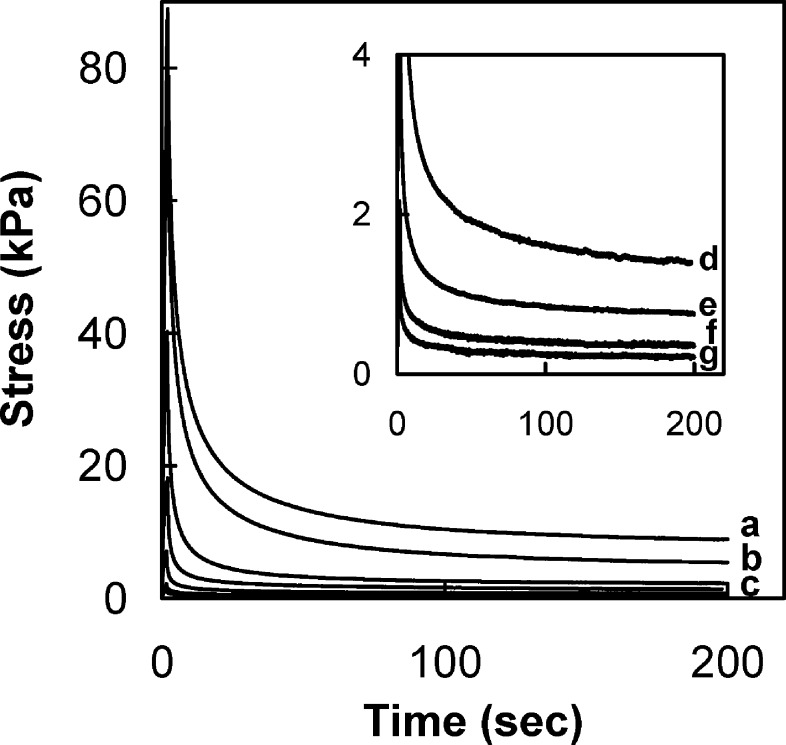
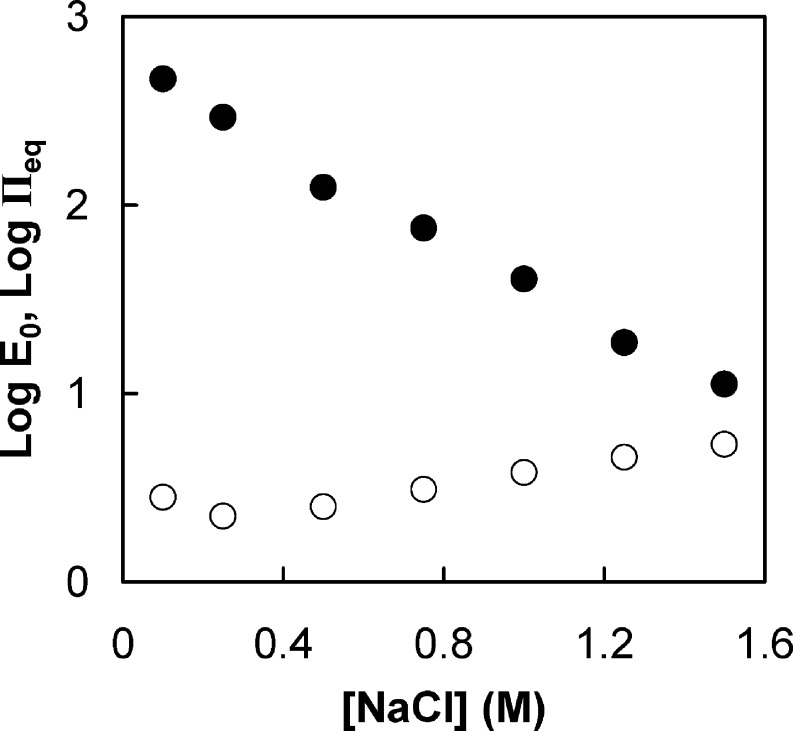
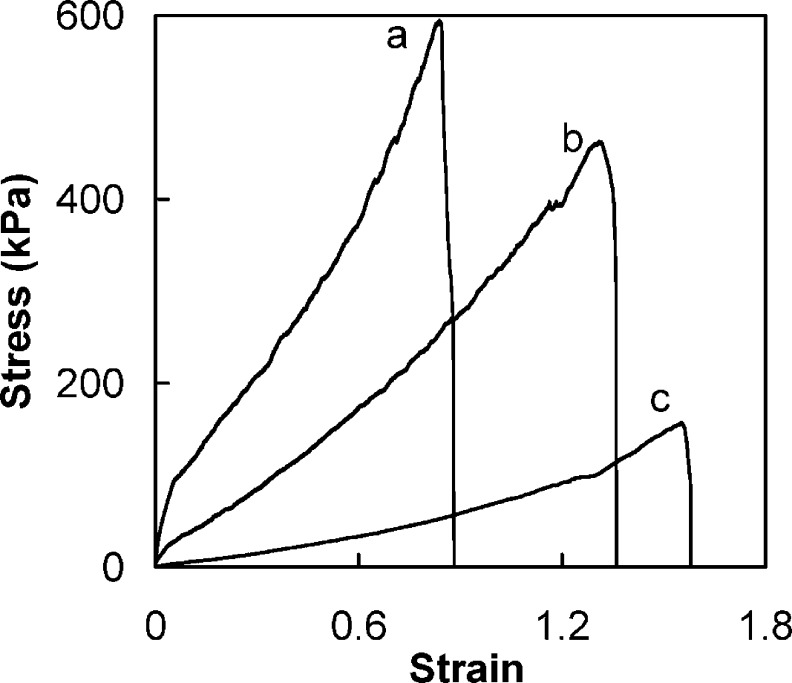
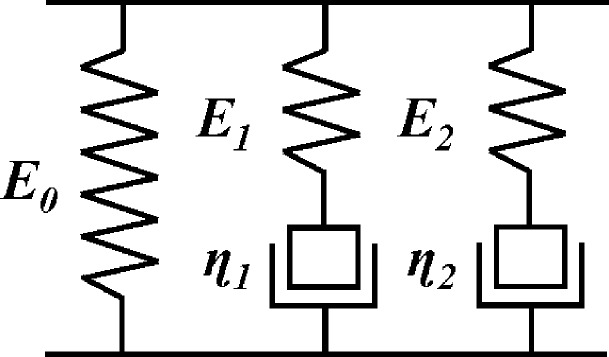
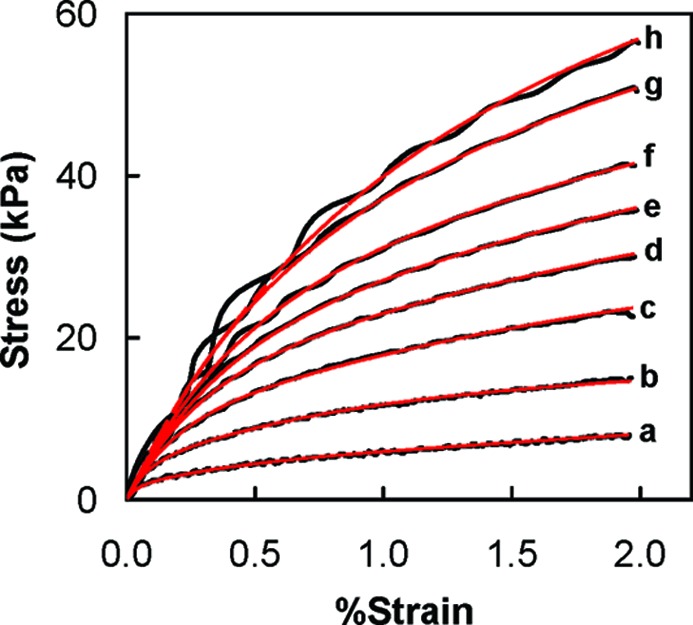
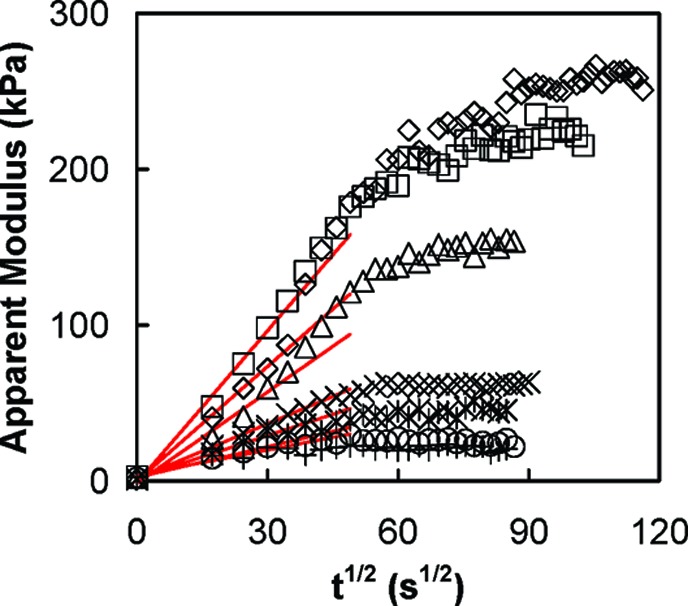
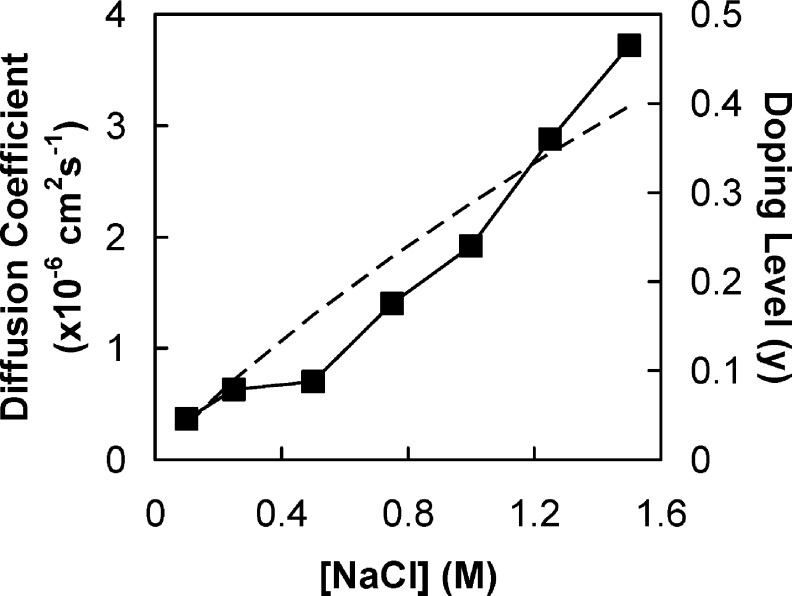
Complexes of sodium poly(4-styrenesulfonate) (NaPSS) and poly(diallyldimethylammonium chloride) (PDADMAC) were formed on mixing equimolar solutions in high salt concentration. Under ultracentrifugal fields, the complex precipitates were transformed into compact polyelectrolyte complexes (CoPECs), which showed extensive porosity. The mechanical properties of CoPECS make them attractive for bioimplants and tissue engineering applications. Free NaPSS chains in the closed pores of CoPECs create excess osmotic pressure, which controls the pore size and contributes to the mechanical resistance of the material. The mechanical properties of CoPECs, modulated by the ionic strength of the doping medium, were studied by uniaxial tensile testing and the stress-strain data were fit to a three-element Maxwell model which revealed at least two regimes of stress relaxation.


Figures

Scheme 1
Scheme 1. Representation of the Internal Structure of a PSS/PDADMA CoPEC
PDADMA chains, PSS chains, and counterions are shown. Intrinsic sites (ion pair crosslinks) are indicated by the rectangles. Non-cross-linked extrinsic sites are compensated by counterions. Pores, boundaries indicated by dotted blue lines, contain excess free PSS chains.
Figure 1
Figure 1
Micrographs of 10 μm thick sections of PSS/PDADMA CoPEC immersed in 0.1 M NaCl (A) and 0.0 M NaCl (B), each for 48 h. The scale bar is 50 μm.
Figure 2
Figure 2
(A) Cumulative percentage of PSS (relative to initial PSS content in the complex) released vs time from PSS/PDADMA CoPECs rinsed and chopped daily. CoPECs were prepared with 0.5 M PDADMA solution and equal volumes of PSS solutions: 0.3 M (◇), 0.4 M (Δ), 0.5 M (○), 0.6 M (◻), 0.7 M (∗), 0.8 M (×), and 0.9 M (+). (B) Total release of PSS after 9 days of rinsing and chopping (◆). The dotted line represents the excess (i.e., beyond stoichiometric) PSS.
Figure 3
Figure 3
Stress relaxation of (1:1) PSS/PDADMA CoPECs doped with different NaCl concentrations: 0.1 M (a), 0.25 M (b), 0.5 M (c), 0.75 M (d), 1 M (e), 1.25 M (f), and 1.5 M (g). The inset shows curves e−g. Samples remained wetted by the doping solution.
Figure 4
Figure 4
Dependence of the equilibrium elastic modulus and equilibrium osmotic pressure in 1:1 PSS/PDADMA CoPEC on the doping NaCl concentration. Key: (●) measured elastic modulus; (○) equilibrium osmotic pressure contributed by PSS in pores. Modulus and osmotic pressure are in kPa.
Figure 5
Figure 5
True stress−true strain plots for PSS/PDADMA CoPECs doped in 0.1 M (a), 0.5 M (b), and 1 M (c) NaCl solutions and stretched to breaking at 1 mm min−1.
Scheme 2
Scheme 2. Wiechert Model, or Generalized Maxwell Model, with an Isolated Spring and two Maxwell Elements
E0, E1, and E2 represent the elastic modulus of the isolated spring, spring of the first Maxwell element, and spring of the second Maxwell, respectively. η1 and η2 are the viscosities of the dashpots in the first and second Maxwell elements, respectively.
Figure 6
Figure 6
Stress−strain curves of a PSS/PDADMA CoPEC doped in 0.5 M NaCl at different strain rates: (a) 2, (b) 5, (c) 7.5, (d) 10, (e) 12, (f) 15, and (g) 20 mm/min. The red curves are fits to eq 3.
Figure 7
Figure 7
Modulus versus square root of time for 1:1 PSS/PDADMA CoPEC doped in NaCl of concentration: 0.1 M (◇); 0.25 M (◻); 0.5 M (Δ); 0.75 M (×); 1 M (∗); 1.25 M (○); 1.5 M (+). E was measured between 1% and 1.5% strain at a strain rate of 1 mm min−1. The solid lines are linear fits for the modulus at short times.
Figure 8
Figure 8
Diffusion coefficient Dapp of sites and doping level in PSS/PDADMA CoPEC as a function of [NaCl]. (◼) Diffusion coefficients. The dashed line is the doping level calculated from eq 5.

Similar articles

Cited by

References

    1. Peng H. T.; Martineau L.; Shek P. N. J. Mater. Sci. Mater. Med. 2007, 18, 975–986. - PubMed
    1. Tanaka Y.; Gong J. P.; Osada Y. Prog. Polym. Sci. 2005, 30, 1–9.
    1. Biot M. A. J. Appl. Phys. 1955, 26, 182–185.
    1. Mak A. F. J. Biomech. Eng. 1986, 108, 123–130. - PubMed
    1. Mow V. C.; Kuei S. C.; Lai W. M.; Armstrong C. G. J. Biomech. Eng. 1980, 102, 73–84. - PubMed

LinkOut - more resources