

Toward the estimation of the absolute quality of individual protein structure models
- PMID: 21134891
- PMCID: PMC3031035
- DOI: 10.1093/bioinformatics/btq662
Toward the estimation of the absolute quality of individual protein structure models
Abstract
Motivation: Quality assessment of protein structures is an important part of experimental structure validation and plays a crucial role in protein structure prediction, where the predicted models may contain substantial errors. Most current scoring functions are primarily designed to rank alternative models of the same sequence supporting model selection, whereas the prediction of the absolute quality of an individual protein model has received little attention in the field. However, reliable absolute quality estimates are crucial to assess the suitability of a model for specific biomedical applications.
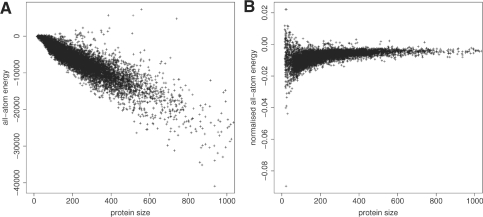
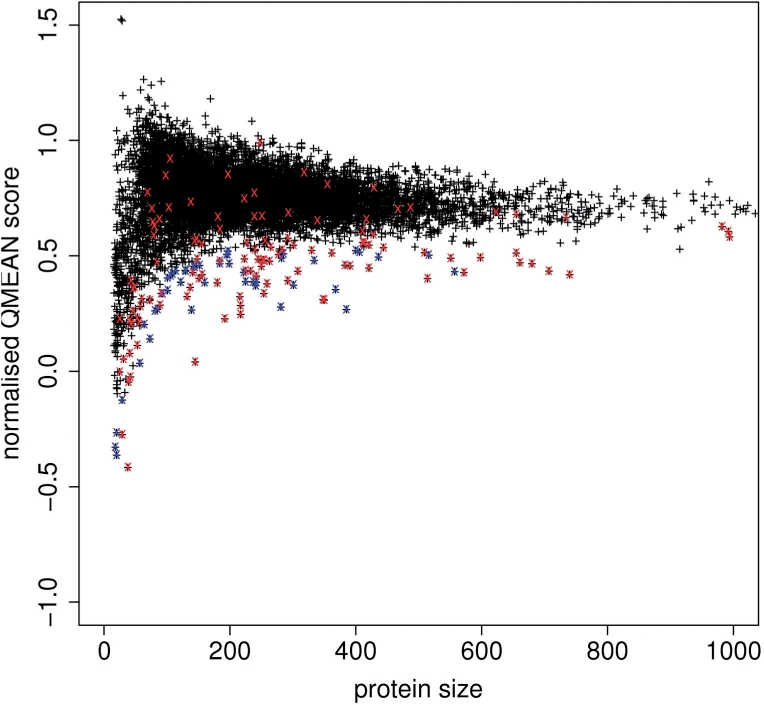
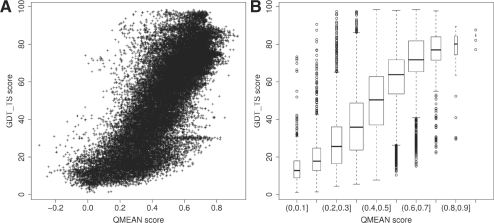
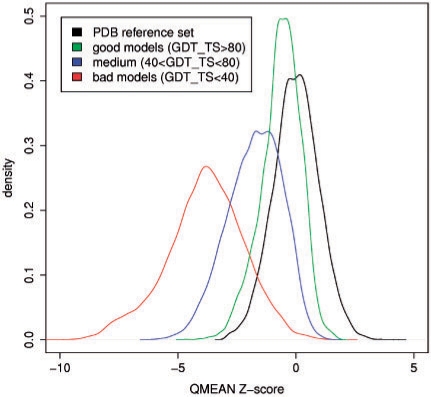
Results: In this work, we present a new absolute measure for the quality of protein models, which provides an estimate of the 'degree of nativeness' of the structural features observed in a model and describes the likelihood that a given model is of comparable quality to experimental structures. Model quality estimates based on the QMEAN scoring function were normalized with respect to the number of interactions. The resulting scoring function is independent of the size of the protein and may therefore be used to assess both monomers and entire oligomeric assemblies. Model quality scores for individual models are then expressed as 'Z-scores' in comparison to scores obtained for high-resolution crystal structures. We demonstrate the ability of the newly introduced QMEAN Z-score to detect experimentally solved protein structures containing significant errors, as well as to evaluate theoretical protein models. In a comprehensive QMEAN Z-score analysis of all experimental structures in the PDB, membrane proteins accumulate on one side of the score spectrum and thermostable proteins on the other. Proteins from the thermophilic organism Thermatoga maritima received significantly higher QMEAN Z-scores in a pairwise comparison with their homologous mesophilic counterparts, underlining the significance of the QMEAN Z-score as an estimate of protein stability.
Availability: The Z-score calculation has been integrated in the QMEAN server available at: http://swissmodel.expasy.org/qmean.
Figures

References
Publication types
MeSH terms
Substances
LinkOut - more resources
Full Text Sources
Other Literature Sources
