

Mortality and morbidity trends: is there compression of morbidity?
- PMID: 21135070
- PMCID: PMC3001754
- DOI: 10.1093/geronb/gbq088
Mortality and morbidity trends: is there compression of morbidity?
Abstract
Objective: This paper reviews trends in mortality and morbidity to evaluate whether there has been a compression of morbidity.
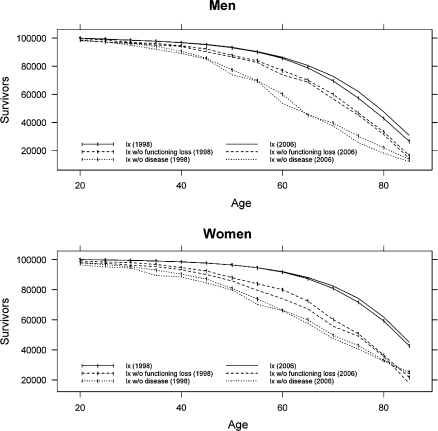
Methods: Review of recent research and analysis of recent data for the United States relating mortality change to the length of life without 1 of 4 major diseases or loss of mobility functioning.
Results: Mortality declines have slowed down in the United States in recent years, especially for women. The prevalence of disease has increased. Age-specific prevalence of a number of risk factors representing physiological status has stayed relatively constant; where risks decline, increased usage of effective drugs is responsible. Mobility functioning has deteriorated. Length of life with disease and mobility functioning loss has increased between 1998 and 2008.
Discussion: Empirical findings do not support recent compression of morbidity when morbidity is defined as major disease and mobility functioning loss.
Figures
References
-
- Anderson RN. United States life tables, 1998. Hyattsville, MD: National Center for Health Statistics; 2001. National Vital Statistics Reports, 48 (pp. 1–40) - PubMed
-
- Arias E. United States life tables, 2006. Hyattsville, MD: National Center for Health Statistics; 2006. National Vital Statistics Reports, 58. - PubMed
-
- Arias E, Rostron B, Tejeda-Vera B. United States life tables, 2005. Hyattsville, MD: National Center for Health Statistics; 2005. National Vital Statistics Reports, 38. - PubMed
-
- Bell FC, Miller ML. Life tables for the United States Social Security Area, 1900–2100. Baltimore, MD: Social Security Administration, Office of the Chief Actuary; 2005.
