. 2011 Feb 25;286(8):5967-76.
doi: 10.1074/jbc.M110.190058. Epub 2010 Dec 6.

A microbial rhodopsin with a unique retinal composition shows both sensory rhodopsin II and bacteriorhodopsin-like properties

Affiliations

A microbial rhodopsin with a unique retinal composition shows both sensory rhodopsin II and bacteriorhodopsin-like properties

Yuki Sudo et al. J Biol Chem. .

Abstract

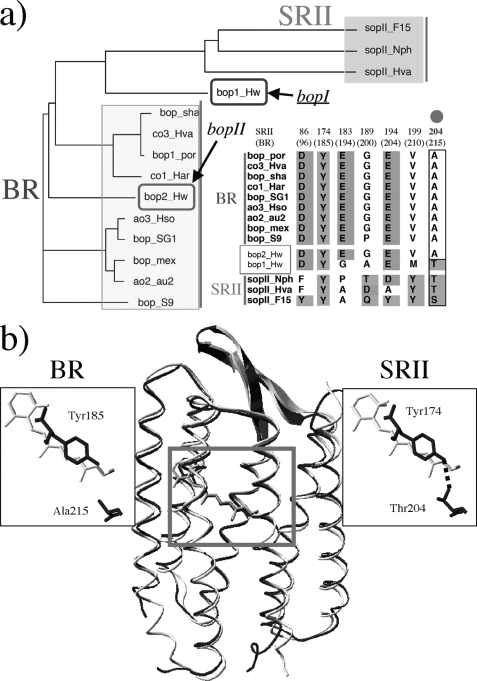
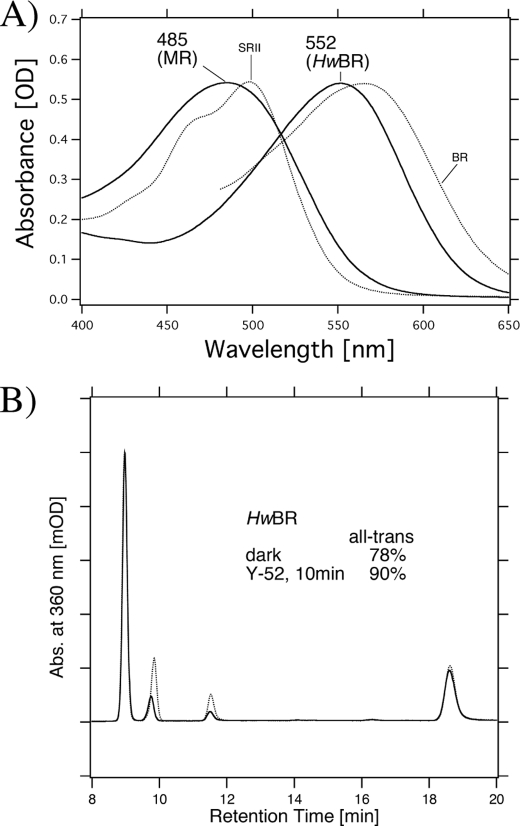
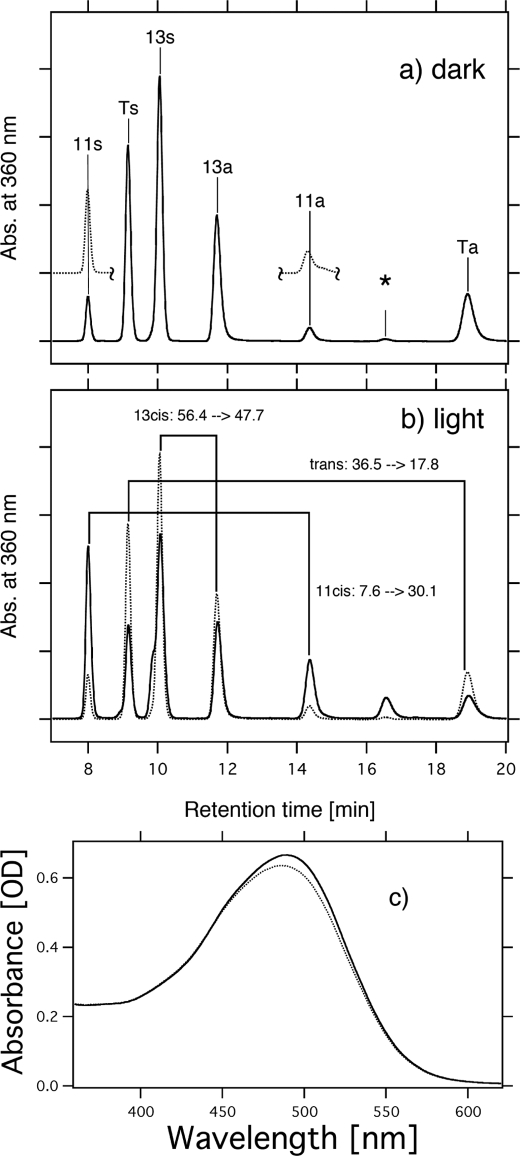
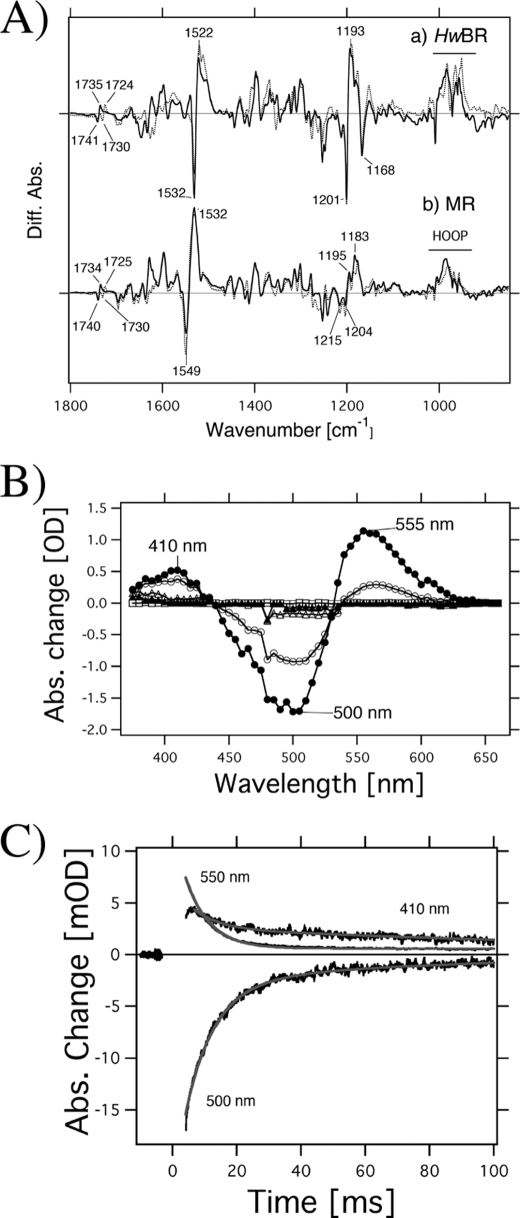
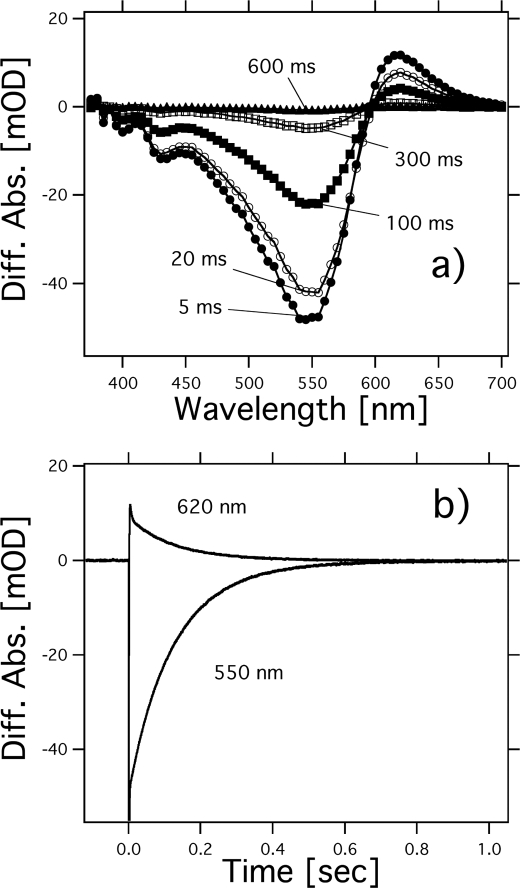
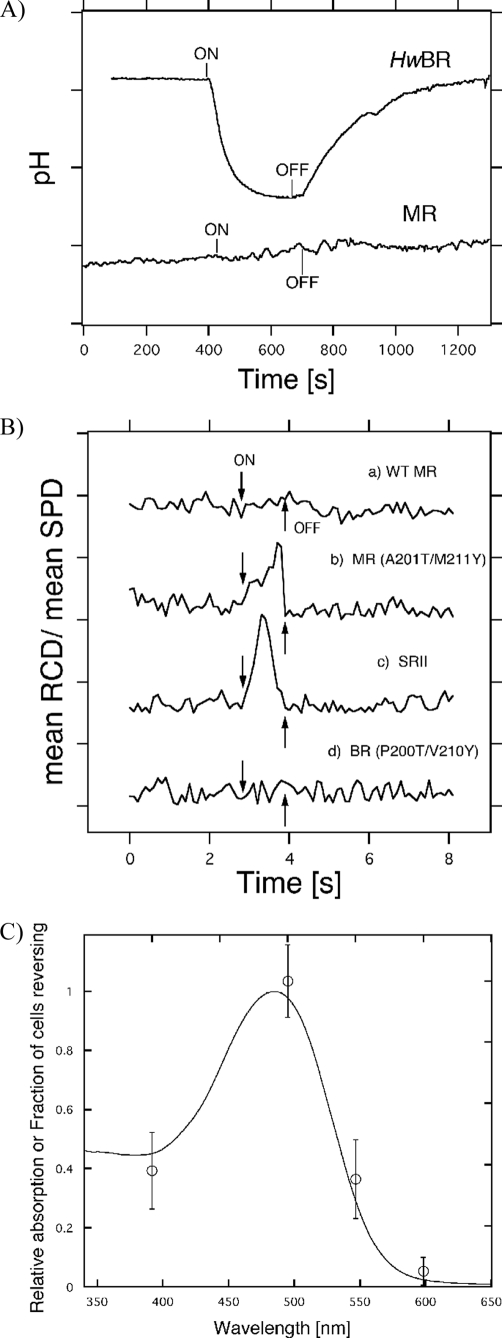
Rhodopsins possess retinal chromophore surrounded by seven transmembrane α-helices, are widespread in prokaryotes and in eukaryotes, and can be utilized as optogenetic tools. Although rhodopsins work as distinctly different photoreceptors in various organisms, they can be roughly divided according to their two basic functions, light-energy conversion and light-signal transduction. In microbes, light-driven proton transporters functioning as light-energy converters have been modified by evolution to produce sensory receptors that relay signals to transducer proteins to control motility. In this study, we cloned and characterized two newly identified microbial rhodopsins from Haloquadratum walsbyi. One of them has photochemical properties and a proton pumping activity similar to the well known proton pump bacteriorhodopsin (BR). The other, named middle rhodopsin (MR), is evolutionarily transitional between BR and the phototactic sensory rhodopsin II (SRII), having an SRII-like absorption maximum, a BR-like photocycle, and a unique retinal composition. The wild-type MR does not have a light-induced proton pumping activity. On the other hand, a mutant MR with two key hydrogen-bonding residues located at the interaction surface with the transducer protein HtrII shows robust phototaxis responses similar to SRII, indicating that MR is potentially capable of the signaling. These results demonstrate that color tuning and insertion of the critical threonine residue occurred early in the evolution of sensory rhodopsins. MR may be a missing link in the evolution from type 1 rhodopsins (microorganisms) to type 2 rhodopsins (animals), because it is the first microbial rhodopsin known to have 11-cis-retinal similar to type 2 rhodopsins.


Figures

FIGURE 1.
FIGURE 1.
a, phylogenetic tree of microbial rhodopsins and alignment of critical amino acids of SRII- and BR-like proteins, including the two newly identified microbial rhodopsins from H. walsbyi (bopI and bopII), created using ClustalW. b, x-ray crystallographic structures of BR from H. salinarum (Protein Data Bank code 1C3W) (23) and SRII from N. pharaonis (Protein Data Bank code 1JGJ) (24), and magnified view of the critical functional site of SRII, the hydrogen bond between Tyr-174 and Thr-204.
FIGURE 2.
FIGURE 2.
A, absorption spectra of MR and HwBR in buffer containing 1 m NaCl, 0. 05% DDM, and 50 mm Tris-HCl, pH 7.0. The temperature was kept at 20 °C. The data for BR and SRII were reproduced from Ref. for comparison. B, conformation of retinal extracted from HwBR in 1 m NaCl, 0.05% DDM, and 50 mm Tris-HCl, pH 7.0, in the dark (dotted line) and after illumination with >500 nm light for 10 min (solid line). The detection beam was set at 360 nm. The molar composition of retinal isomers was calculated from the areas of the peaks in the HPLC patterns. One division of the y axis corresponds to 2000 absorbance units.
FIGURE 3.
FIGURE 3.
Conformation of retinal extracted from MR in 1 m NaCl, 0.05% DDM, and 50 mm Tris-HCl, pH 7.0, in the dark (a) and upon illumination with >460 nm light for 10 min (b). The detection beam was set at 360 nm. Ts, Ta, 11s, 11a, 13s, and 13a stand for all-trans-15-syn-retinal oxime, all-trans-15-anti-retinal oxime, 11-cis-15-syn-retinal oxime, 11-cis-15-anti-retinal oxime, 13-cis-15-syn-retinal oxime, and 13-cis-15-anti-retinal oxime, respectively. The HPLC pattern of 11-cis-retinal obtained by irradiating all-trans-retinal is shown as dotted lines (a). One division of the y axis of a and b corresponds to 5000 absorbance units. An asterisk means an unknown peak, presumably originating from 9-cis-retinal oxime. The molar composition of retinal isomers was calculated from the areas of the peaks in the HPLC patterns. c, absorption spectra measured in the dark (dotted line) and upon illumination with >460 nm light for 10 min (solid line).
FIGURE 4.
FIGURE 4.
A, HwBRK minus HwBR (a) and MRK minus MR (b) difference infrared spectra measured at 77 K at pH 7.0 in the 1800–850 cm−1 region. The MRK minus MR spectrum (b) is multiplied by 3.8 for comparison. The sample was hydrated with H2O (solid lines) or D2O (dashed lines). One division of the y axis corresponds to 0.0055 absorbance units. B, flash-induced difference spectra of MR in a spectral range from 375 to 660 nm. The purified MR was resuspended in 50 mm Tris-HCl, pH 7.0, 0.05% DDM, and 1 m NaCl. Closed and open circles are spectra taken at 1.5 and 10.5 ms after the illumination, respectively. The temperature was kept at 25 °C. C, flash-induced kinetics of absorbance changes of MR at 410 nm representing the M-decay and at 500 nm representing the recovery of the original MR. The absorbance change at 550 nm presumably originates from a photointermediate of MR having 13-cis- and/or 11-cis-retinal chromophore. Gray lines show single exponential fits.
FIGURE 5.
FIGURE 5.
Photochemical reactions of HwBR. a, flash-induced difference spectra of HwBR in a spectral range from 380 to 700 nm. The purified HwBR was resuspended in 50 mm Tris-HCl, pH 7.0, 0.05% DDM, and 1 m NaCl. Curves represent the spectra taken at 5, 20, 100, 300, and 600 ms after the illumination. The temperature was kept at 25 °C. b, flash-induced kinetics of absorbance changes of HwBR at 620 nm, presumably representing the O-decay and at 550 nm representing the recovery of the original HwBR.
FIGURE 6.
FIGURE 6.
A, light-driven pH changes in spheroplast vesicles containing HwBR or MR (50 mm MgSO4, 150 mm NaCl, initial pH ∼6.5). On and Off indicate the onset and offset of illumination (with yellow light, >500 nm for HwBR and >460 nm for MR), and the negative signal corresponds to a decrease in pH (outward proton transport). One division of the y axis corresponds to 0.1 pH unit. B, phototaxis responses of the MR-HtrII artificial complexes. On and Off indicate the onset and offset of illumination with >460 nm stimulus (1 s). Swimming reversal frequency responses of cell populations measured by stimulus effects on the ratio of rate of change of direction (RCD) to speed (SPD) by computer-assisted motion analysis. One division of the y axis corresponds to 50. C, action spectrum for the phototactic response in the transformant containing MR(P201T/M211Y)-HtrII. We measured phototaxis responses as swimming frequency changes to 1-s photo stimuli. Light intensities were normalized by using an actinometer, and we used four filters (400 ± 10, 500 ± 10, 550 ± 10, and 600 ± 10 nm).

References

    1. Spudich J. L. (2006) Trends Microbiol. 14, 480–487 - PubMed
    1. Zhang F., Aravanis A. M., Adamantidis A., de Lecea L., Deisseroth K. (2007) Nat. Rev. Neurosci. 8, 577–581 - PubMed
    1. Costanzi S., Siegel J., Tikhonova I. G., Jacobson K. A. (2009) Curr. Pharm. Des. 15, 3994–4002 - PMC - PubMed
    1. Ruiz-González M. X., Marín I. (2004) J. Mol. Evol. 58, 348–358 - PubMed
    1. Sharma A. K., Spudich J. L., Doolittle W. F. (2006) Trends Microbiol. 14, 463–469 - PubMed

Publication types

MeSH terms

LinkOut - more resources