. 2011 Feb 25;286(8):5985-94.
doi: 10.1074/jbc.M110.170126. Epub 2010 Dec 6.

A high redox potential form of cytochrome c550 in photosystem II from Thermosynechococcus elongatus

Affiliations

A high redox potential form of cytochrome c550 in photosystem II from Thermosynechococcus elongatus

Fernando Guerrero et al. J Biol Chem. .

Abstract

Cytochrome c(550) (cyt c(550)) is a component of photosystem II (PSII) from cyanobacteria, red algae, and some other eukaryotic algae. Its physiological role remains unclear. In the present work, measurements of the midpoint redox potential (E(m)) were performed using intact PSII core complexes preparations from a histidine-tagged PSII mutant strain of the thermophilic cyanobacterium Thermosynechococcus (T.) elongatus. When redox titrations were done in the absence of redox mediators, an E(m) value of +200 mV was obtained for cyt c(550). This value is ∼300 mV more positive than that previously measured in the presence of mediators (E(m) = -80 mV). The shift from the high potential form (E(m) = +200 mV) to the low potential form (E(m) = -80 mV) of cyt c(550) is attributed to conformational changes, triggered by the reduction of a component of PSII that is sequestered and out of equilibrium with the medium, most likely the Mn(4)Ca cluster. This reduction can occur when reduced low potential redox mediators are present or under highly reducing conditions even in the absence of mediators. Based on these observations, it is suggested that the E(m) of +200 mV obtained without mediators could be the physiological redox potential of the cyt c(550) in PSII. This value opens the possibility of a redox function for cyt c(550) in PSII.


Figures

FIGURE 1.
FIGURE 1.
Reductive potentiometric titrations of cyt b559 and c550 in PSII core complexes in the presence of a mixture of eight redox mediators covering the potential range between +430 and 0 mV. A and B, difference absorption spectra in the α-band region of cyt b559 and cyt c550. The spectra were obtained by subtracting absolute spectra recorded during the course of the redox titration between +455 and −80 mV minus the spectrum recorded at +455 mV (A) and the spectra recorded between +210 mV and −300 mV minus the absolute spectrum recorded at +210 mV (B). For simplification, only a set of selected spectra are included in A and B. C and D, plot of the percentages of reduced cyt b559 and reduced cyt c550 obtained from the absorbance differences at 559–570 nm and 549–538 nm versus ambient redox potentials, respectively. The solid curves represent the best fit of the experimental data to the Nernst equation in accordance with one-electron processes (n = 1) for two components (C) with an Em of +246 mV (20%) and +389 mV (80%) and for one component (D) with an Em of −20 mV.
FIGURE 2.
FIGURE 2.
Reductive potentiometric titrations of cyt b559 and c550 in PSII core complexes without redox mediators in the presence of 25 μm potassium ferricyanide. A and B, difference absorption spectra in the α-band region of cyt b559 and cyt c550. The spectra were obtained by subtracting absolute spectra recorded during the course of the redox titration between +430 and −80 mV minus the spectrum recorded at +430 mV (A) and the spectra recorded between +220 mV and −80 mV minus the absolute spectrum recorded at +230 mV (B). For simplification, only a set of selected spectra are included in A and B. C and D, plot of the percentages of reduced cyt b559 and reduced cyt c550 obtained from the absorbance differences at 559–570 nm and 549–538 nm versus ambient redox potentials, respectively. The solid curves represent the best fit of the experimental data to the Nernst equation in accordance with one-electron processes (n = 1) for two components (C) with Em of +222 mV (20%) and +392 mV (80%) and for one component (D) with Em of +200 mV.
FIGURE 3.
FIGURE 3.
Reductive potentiometric titration of cyt c550 in PSII core complexes with 20 μm diaminodurol and 25 μm of potassium ferricyanide. A, difference absorption spectra in the α-band region of cyt c550. The spectra were obtained by subtracting absolute spectra recorded during the course of titration minus the absolute spectrum recorded at +240 mV. For simplification, only a set of selected spectra are included. B, plots of the percentages of reduced cyt c550 obtained from the absorbance differences at 549–538 nm versus ambient redox potentials. The solid curve represents the best fits of the experimental data to the Nernst equation in accordance with one-electron processes (n = 1) for one component with Em of +215 mV.
FIGURE 4.
FIGURE 4.
Oxidative potentiometric titrations of cyt c550 in PSII core complexes in the absence and presence of redox mediators. A and B, plots of the percentages of reduced cyt c550 obtained from the absorbance differences at 549–538 nm versus ambient redox potentials in PSII core complexes in the absence and in the presence of the mixture of eight redox mediators covering the potential range between +430 and 0 mV, respectively (see “Experimental Procedures”). The solid curve represents the best fits of the experimental data to the Nernst equation in accordance with one-electron processes (n = 1) for one component with Em of −220 mV and −215 mV, respectively. Insets, difference absorption spectra in the α-band region of cyt c550 obtained by subtracting the absolute spectrum recorded at −330 mV from those recorded during the course of the redox titration with potassium ferricyanide in the absence or in the presence of redox mediators, respectively. For simplification, only a set of selected spectra are included.
FIGURE 5.
FIGURE 5.
Reversibility of the potentiometric titrations of cyt c550 in PSII core complexes in the absence of redox mediators. The plot represents titration curves corresponding to further cycles of reduction and oxidation (up to three) in the same PSII core complexes preparations. The percentages of reduced cyt c550 were plotted versus ambient redox potentials in the first reductive titration (curve 1), in the first oxidative titration (curve 2) and in the second reductive titration (curve 3). Each curve was fitted to the Nernst equation in accordance with one-electron processes (n = 1) for one component.
FIGURE 6.
FIGURE 6.
Effect of sodium dithionite on the formation of the S2 multiline EPR signal. PSII complexes were incubated 10 min (A) or 1 min (B) in the absence (a) and in the presence of 2 mm of sodium dithionite (b and c). All spectra were difference spectra after 200 K illumination (light minus dark). a, untreated PSII; b, PSII complexes reduced by sodium dithionite and reoxidized by potassium ferricyanide; c, sample b was thawed and then was dark adapted at room temperature for 30 min, illuminated by a series of three flashes and finally dark adapted for 30 min. Instrument settings were as follows: microwave power, 20 milliwatt; modulation amplitude, 25 gauss; temperature, 8.5 K.
FIGURE 7.
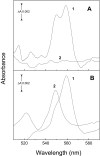
FIGURE 7.
Effect of sodium dithionite on the association of cyt c550 to PSII. Difference absorption spectra of cyt b559 and cyt c550 were recorded from the pellet (spectrum 1) and the supernatant (spectrum 2) obtained by precipitation of PSII core complex preparations. The spectra were obtained by subtracting the absolute spectrum at −430 mV (the spectrum of reduced cyt b559 and cyt c550) minus at +430 mV (the spectrum of oxidized cyt b559 and cyt c550) in PSII core complex preparation untreated (A) and treated (B) with 2 mm of sodium dithionite during 30 min.

References

    1. Barber J. (2009) Chem. Soc. Rev. 38, 185–196 - PubMed
    1. Zouni A., Witt H. T., Kern J., Fromme P., Krauss N., Saenger W., Orth P. (2001) Nature 409, 739–743 - PubMed
    1. Kamiya N., Shen J. R. (2003) Proc. Natl. Acad. Sci. U.S.A. 100, 98–103 - PMC - PubMed
    1. Ferreira K. N., Iverson T. M., Maghlaoui K., Barber J., Iwata S. (2004) Science 303, 1831–1838 - PubMed
    1. Biesiadka J., Loll B., Kern J., Irrgang K. D., Zouni A. (2004) Phys. Chem. Chem. Phys. 6, 4733–4736

Publication types

MeSH terms