. 2010 Dec 13;191(6):1189-203.
doi: 10.1083/jcb.201005035. Epub 2010 Dec 6.

PTP1B regulates Eph receptor function and trafficking

Affiliations

PTP1B regulates Eph receptor function and trafficking

Eva Nievergall et al. J Cell Biol. .

Abstract

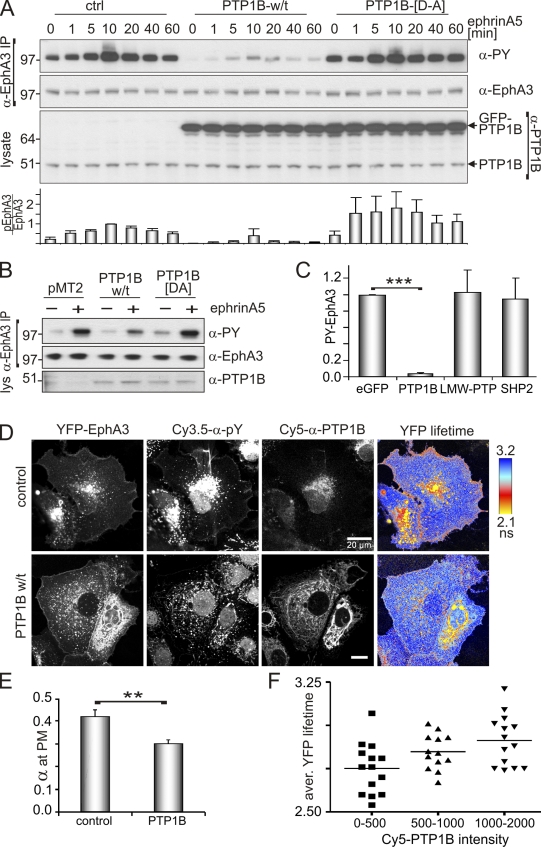
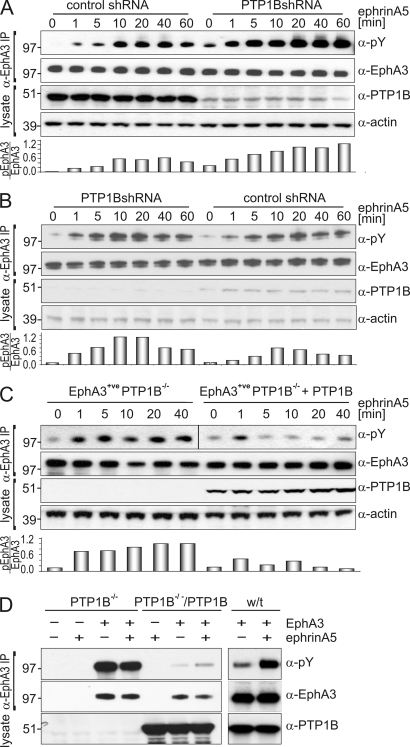
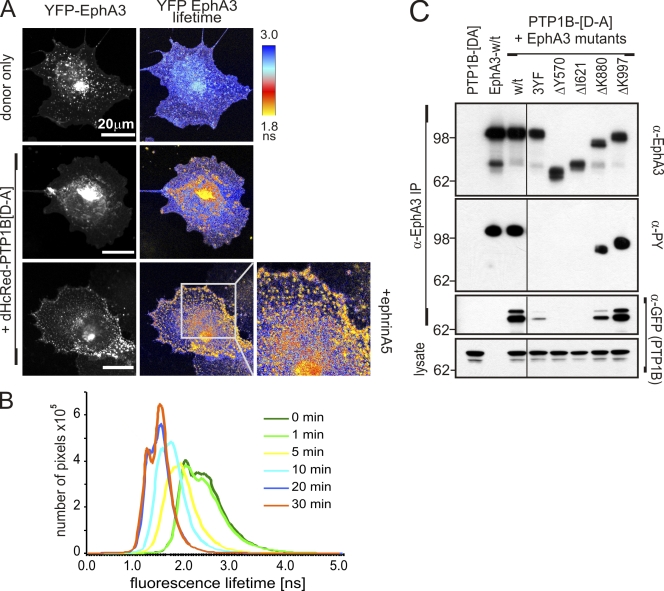
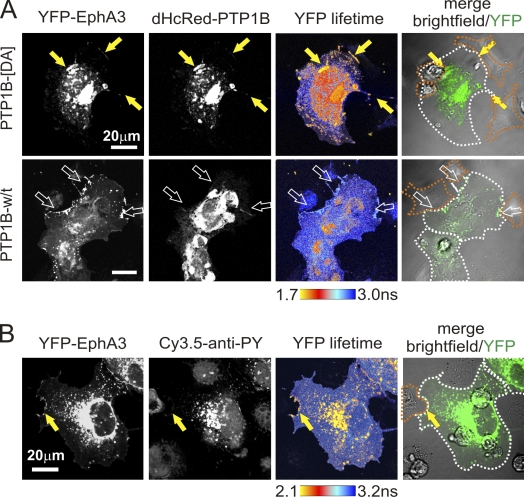
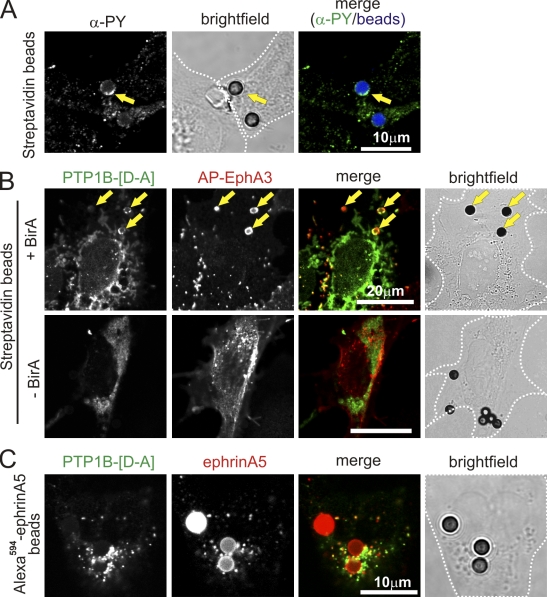
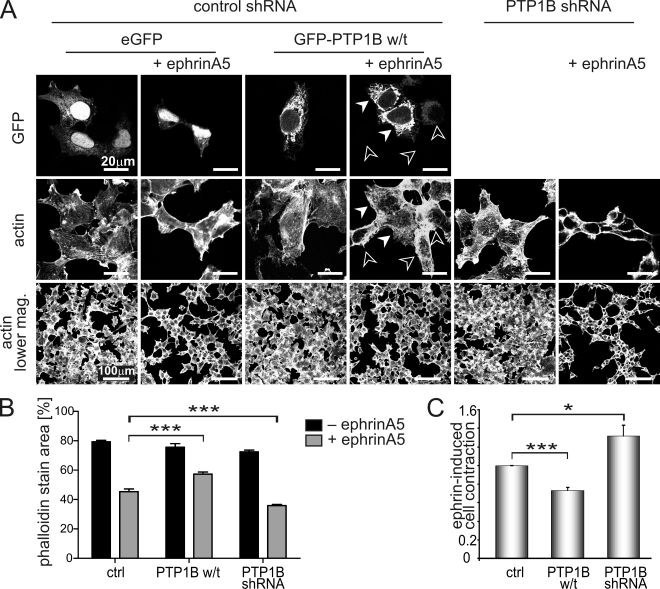
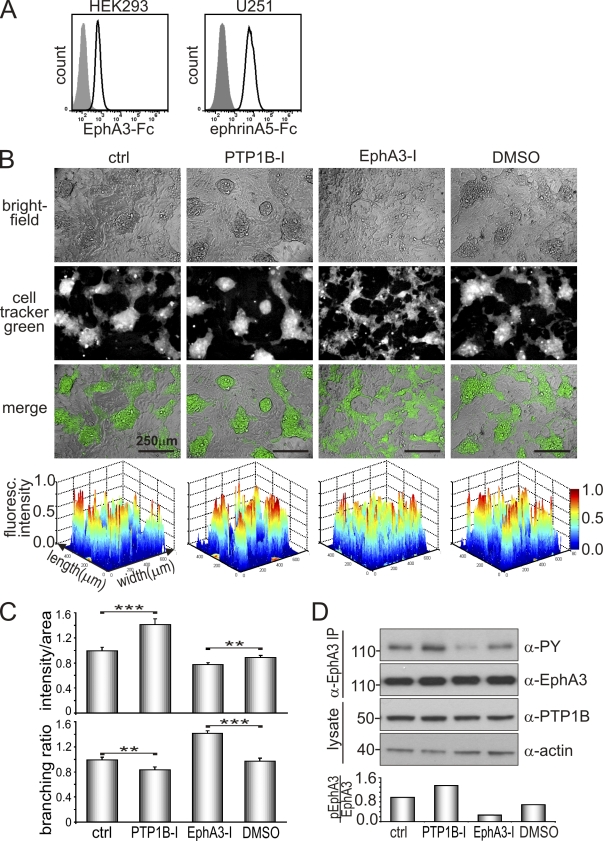
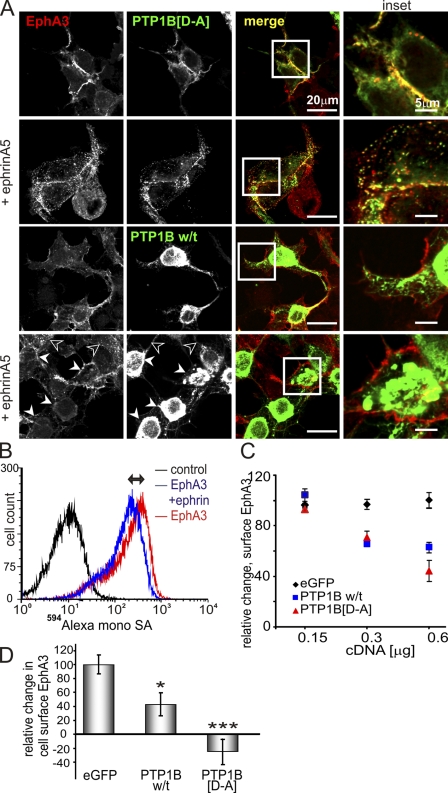
Eph receptors orchestrate cell positioning during normal and oncogenic development. Their function is spatially and temporally controlled by protein tyrosine phosphatases (PTPs), but the underlying mechanisms are unclear and the identity of most regulatory PTPs are unknown. We demonstrate here that PTP1B governs signaling and biological activity of EphA3. Changes in PTP1B expression significantly affect duration and amplitude of EphA3 phosphorylation and biological function, whereas confocal fluorescence lifetime imaging microscopy (FLIM) reveals direct interactions between PTP1B and EphA3 before ligand-stimulated receptor internalization and, subsequently, on endosomes. Moreover, overexpression of wild-type (w/t) PTP1B and the [D-A] substrate-trapping mutant decelerate ephrin-induced EphA3 trafficking in a dose-dependent manner, which reveals its role in controlling EphA3 cell surface concentration. Furthermore, we provide evidence that in areas of Eph/ephrin-mediated cell-cell contacts, the EphA3-PTP1B interaction can occur directly at the plasma membrane. Our studies for the first time provide molecular, mechanistic, and functional insights into the role of PTP1B controlling Eph/ephrin-facilitated cellular interactions.


Figures

Figure 1.
Figure 1.
PTP1B controls ephrin-induced phosphorylation of EphA3. (A) α-EphA3 immunoprecipitates and whole cell lysates from GFP-PTP1B, GFP-PTP1B-[D-A], or control vector-transfected EphA3/HEK293T cells, treated with ephrinA5-Fc, were analyzed by Western blotting with antibodies as indicated. The ratio of phosphorylated EphA3/total EphA3 (n = 3) was estimated (densitometry); mean ± SE are shown (error bars). (B) α-EphA3 immunoprecipitates and cell lysates of PTP1B, PTP1B-[D-A], or control vector (pMT2)-transfected 22Rv1 prostate carcinoma cells, with or without 10 min of ephrinA5 stimulation, were immunoblotted with the appropriate antibodies. Molecular mass standards are indicated next to the gel blots in kilodaltons. (C) EphrinA5-induced EphA3 phosphorylation in α-EphA3 immunoprecipitates from EphA3/HEK293T cells transfected with EGFP (control) vector, GFP-PTP1B, GFP-LMW-PTP, or GFP-SHP2, was quantified by densitometry analysis of Western blots (n = 3); mean PY-EphA3 levels, normalized to the EGFP-transfected control, ±SE are shown (error bars; ***, P < 0.001). (D) EphrinA5-induced EphA3 phosphorylation was monitored in PTP1B w/t and in control vector-transfected COS7 cells by confocal FLIM using YFP-EphA3 as fluorescence donor and Cy3.5-labeled PY72 as an acceptor. The YFP fluorescence lifetime maps are illustrated together with confocal micrographs revealing YFP-EphA3, PY, and PTP1B, the latter detected with labeled α-PY (Cy3.5PY72) and α-PTP1B (Cy5FG6) antibodies. Endogenous PTP1B (top) is shown at a higher display setting compared with recombinant w/t PTP1B (bottom). (E) The relative fraction (α) of membrane-proximal activated EphA3 receptors in PTP1B-overexpressing and control cells was calculated pixel-by-pixel from the ratio of the amplitude of the short lifetime component and the sum of the two amplitudes (n = 40 cells); mean ± SE are shown (error bars; **, P < 0.005). (F) The correlation between EphA3-YFP lifetimes (averaged across the whole cell) and the PTP1B expression level (determined from the fluorescence intensity of Cy5-α-PTP1B staining) is illustrated, where increased lifetime indicates decreased EphA3 phosphorylation. Each data point represents measurements from an individual cell.
Figure 2.
Figure 2.
Abrogated PTP1B expression causes enhanced and prolonged EphA3 activation. (A and B) EphA3/HEK293Ts (A) and 22Rv1 cells (B), stably transfected with PTP1B-shRNA– or nontarget control vector–containing lentiviral transduction particles, were subjected to ephrinA5 stimulation. α-EphA3 immunoprecipitates and whole cell lysates were examined by immunoblotting with the appropriate antibodies. Densitometry quantifies EphA3 phosphorylation relative to total EphA3 expression. Data are representative of at least five (A) and three (B) independent experiments, respectively. (C) The time course of ephrinA5-induced EphA3 phosphorylation in PTP1B-reconstituted or parental PTP1B−/− MEFs, both stably transfected with EphA3, was assessed by immunoblotting of anti-EphA3 immunoprecipitates using antibodies against EphA3, PY, and PTP1B, as indicated. Densitometry quantifies relative EphA3 phosphorylation, which is representative of two experimental repeats. The black line indicates that intervening lanes have been spliced out. (D) PTP1B−/− MEFs with or without reconstitution with w/t PTP1B and w/t MEFs were transiently transfected with EphA3. α-EphA3 immunoprecipitates from ephrinA5-stimulated or nonstimulated cells were analyzed by Western blot analysis using antibodies against PY-EphA3, EphA3, and PTP1B as indicated. Molecular mass standards are indicated next to the gel blots in kilodaltons.
Figure 3.
Figure 3.
The interaction between PTP1B and EphA3 is kinase dependent. (A) The association between YFP-EphA3 and dHcRed-PTP1B-[D-A] in untreated or ephrinA5-stimulated COS7 cells was analyzed by confocal FLIM. Confocal micrographs of YFP-EphA3 (donor) fluorescence and the YFP fluorescence lifetime maps are shown. The boxed area in the bottom right is shown at higher magnification. (B) COS7 cells transfected with YFP-EphA3 and dHcRed-PTP1B-[D-A] were stimulated with ephrinA5, and live cells were analyzed by FLIM. The distribution of YFP fluorescence lifetimes at various time points during stimulation is plotted. The corresponding confocal images and lifetime maps are presented in Fig. S4 A. (C) NG108 cells, lacking endogenous Ephs (Elowe et al., 2001), cotransfected with cDNAs encoding GFP-PTP1B-[D-A] and w/t or mutant EphA3 (containing tyrosine-replacement or truncation mutants as indicated) were stimulated with ephrinA5 before lysis, α-EphA3 immunoprecipitation, and Western blot analysis with antibodies as indicated. The black line indicates that intervening lanes have been spliced out. Molecular mass standards are indicated next to the gel blots in kilodaltons.
Figure 4.
Figure 4.
PTP1B is recruited to sites of Eph/ephrin contact. (A) COS7 cells overexpressing YFP-EphA3 and dHcRed-PTP1B-[D-A] or w/t dHcRed-PTP1B were co-cultured (20 min) with ephrinA5/HEK293T cells and analyzed by FLIM to monitor direct interactions between EphA3 and PTP1B. Confocal images and YFP-EphA3 lifetime maps are shown. White broken lines mark the boundaries of EphA3-expressing cells; orange dotted lines mark those of ephrinA5 cells. Yellow arrows indicate EphA3-associated PTP1B-[D-A] and FRET at PM interfaces with ephrinA5-expressing cells. Open arrows indicate accumulated EphA3 in w/t dHcRed-PTP1B–expressing cells at sites of contact with ephrinA5 cells. (B) Co-cultures (20 min) between YFP-EphA3 expressing COS7 cells and ephrinA5-expressing HEK/293T cells were fixed, permeabilized, and stained with Cy3.5-tagged α-PY antibody to monitor EphA3 phosphorylation by using FRET between YFP-EphA3 and the Cy3.5-α-PY antibody. Dotted lines are as described in A. Yellow arrows indicate EphA3-associated Cy3.5-α-PY antibody and FRET at sites of marked EphA3 phosphorylation.
Figure 5.
Figure 5.
PTP1B interacts with EphA3 at the cell surface. (A) EphA3 clustering by SA beads provokes tyrosine phosphorylation. COS7 cells, cotransfected with APN-EphA3 and BirA, were stimulated with SA Dynabeads. Tyrosine phosphorylation was evaluated by confocal microscopy of fixed and permeabilized cells stained with Cy3.5α-PY (PY72) antibodies. SA Dynabeads appear blue in the merged image; yellow arrows mark beads with α-PY association. (B) COS7 cells, cotransfected with GFP-PTP1B-[D-A], APN-EphA3, and TM-BirA (as indicated), were stimulated with SA Dynabeads. Cell surface EphA3 was labeled on intact cells with IIIA4 α-EphA3 mAb and detected with Alexa Fluor 546–labeled secondary antibodies by confocal microscopy. Yellow arrows mark SA Dynabeads where PTP1B/EphA3 colocalization is apparent. (C) GFP-PTP1B-[D-A] and EphA3-transfected COS7 cells were stimulated with Alexa Fluor 594–ephrinA5–Fc–coated Protein A Dynabeads, then fixed and analyzed by confocal microscopy. White dotted lines mark cell boundaries from bright-field images.
Figure 6.
Figure 6.
Modulation of PTP1B expression alters ephrin-induced cell contraction. (A) EphA3/HEK293T cells stably transfected with PTP1B-shRNA and nontarget control shRNA EphA3/HEK293T cells transiently expressing GFP alone (control) or w/t GFP-PTP1B were stimulated with ephrinA5 (40 min) or left untreated. Cell morphology, observed by Alexa Fluor 647–phalloidin staining and GFP-(PTP1B) expression, was analyzed by confocal microscopy. Closed and open arrowheads mark cells with high and low PTP1B levels, respectively. (B) Thresholded fluorescence area of Alexa Fluor 647–phalloidin staining was determined in 10 low-magnification images per condition of the experiment shown in A and plotted as mean ± SE (error bars; ***, P < 0.001). (C) Relative ephrinA5-induced cell contraction was estimated from the ratio of the actin-associated fluorescence footprint in micrographs taken after and before ephrinA5 treatment: whole 18-mm-diameter coverslips (equivalent to 100 low-magnification images; A) of phalloidin-stained cells were imaged by “tile scanning” on a fluorescence microscope. Mean ± SE from five separate experiments are shown (error bars; ***, P < 0.001; *, P < 0.05).
Figure 7.
Figure 7.
PTP1B activity affects Eph/ephrin-mediated cell segregation. (A) HEK293 and U251 cells were allowed to bind EphA3-Fc and ephrinA5-Fc, respectively, before labeling with Alexa Fluor 647–α-human secondary antibodies and flow cytometry analysis. (B) Cell segregation was monitored in co-cultures of U251 cells and cell tracker green–labeled HEK293 cells in the presence or absence of PTP1B inhibitor (10 µM PTP1B-I), EphA3 inhibitor (10 µM EphA3-I), or DMSO (as control for EphA3-I) for 72 h. Bright-field, fluorescence, and merged images of PFA fixed cell cultures are shown. Contour plots of cell tracker green fluorescent images were generated (MatLab) to illustrate the accumulation of HEK293 cells and the effects of the inhibitor on sorting of mixed HEK293 and U251 cell populations (bottom); their quantification is shown in Fig. S3. (C) Additional quantification of the segregation assay was performed by analyzing ratios of overall fluorescence intensity/area, and the branching ratio of fluorescent areas using ImageJ software. For each setting, cell tracker green images equivalent to 60 fields of view (as shown in B) were analyzed for n = 3 independent experiments. Mean ± SE are shown (error bars; **, P < 0.01; ***, P < 0.001). (D) Co-cultures of HEK293 and U251 cells were treated with PTP1B or EphA3 inhibitor as indicated for 48 h. Lysates and α-EphA3 immunoprecipitates were subjected to Western blot analysis with the appropriate antibodies. Levels of phosphorylated EphA3 relative to total expression were determined by densitometry. Data are representative of at least two independent experiments. Molecular mass standards are indicated next to the gel blots in kilodaltons.
Figure 8.
Figure 8.
Elevated expression of w/t PTP1B or PTP1B-[D-A] inhibits EphA3 endocytosis. (A) EphrinA5-Fc stimulated (10 min) EphA3/HEK293T cells expressing exogenous GFP-PTP1B-[D-A] or w/t GFP-PTP1B were fixed, permeabilized, and labeled with α-EphA3 and Alexa Fluor 546–labeled secondary antibodies for confocal microscopy. Individual fluorescent channels and merged images are shown. Closed and open arrowheads denote cells with highly elevated and low levels of PTP1B, respectively. Areas of interest are boxed and shown at increased magnification (insets). (B) The level of biotinylated EphA3 on the surface of APN-EphA3/TM-BirA/HEK293T cells was determined by flow cytometry using Alexa Fluor 594–monoSA. The Alexa Fluor 594–monoSA intensity of ephrin-stimulated (20 min) cells is reduced compared with untreated cells, which reflects EphA3 internalization (↔). (C) The relative ephrinA5-induced change in cell surface EphA3 was determined as in B in cells transfected with pEGFP (control), w/t GFP-PTP1B, or GFP-PTP1B–[D-A] at cDNA concentrations of 0.15, 0.3, or 0.6 µg/well as indicated. Mean ± SE from three individual samples from each condition are shown (error bars). (D) 22Rv1 cells transfected with EGFP, GFP-PTP1B-[D-A], or w/t GFP-PTP1B were stimulated with ephrinA5-Fc for 20 min, and cell surface EphA3 was labeled using sheep α-EphA3 and Alexa Fluor 647 secondary antibodies, analyzed by flow cytometry, and evaluated as described in B. Mean ± SE from six individual samples of two separate experiments are shown (error bars; *, P < 0.05; ***, P < 0.001).

References

    1. Anderie I., Schulz I., Schmid A. 2007. Direct interaction between ER membrane-bound PTP1B and its plasma membrane-anchored targets. Cell. Signal. 19:582–592 10.1016/j.cellsig.2006.08.007 - DOI - PubMed
    1. Arregui C.O., Balsamo J., Lilien J. 1998. Impaired integrin-mediated adhesion and signaling in fibroblasts expressing a dominant-negative mutant PTP1B. J. Cell Biol. 143:861–873 10.1083/jcb.143.3.861 - DOI - PMC - PubMed
    1. Bourdeau A., Dubé N., Tremblay M.L. 2005. Cytoplasmic protein tyrosine phosphatases, regulation and function: the roles of PTP1B and TC-PTP. Curr. Opin. Cell Biol. 17:203–209 10.1016/j.ceb.2005.02.001 - DOI - PubMed
    1. Boute N., Boubekeur S., Lacasa D., Issad T. 2003. Dynamics of the interaction between the insulin receptor and protein tyrosine-phosphatase 1B in living cells. EMBO Rep. 4:313–319 10.1038/sj.embor.embor767 - DOI - PMC - PubMed
    1. Burridge K., Sastry S.K., Sallee J.L. 2006. Regulation of cell adhesion by protein-tyrosine phosphatases. I. Cell-matrix adhesion. J. Biol. Chem. 281:15593–15596 10.1074/jbc.R500030200 - DOI - PubMed

Publication types

MeSH terms

Substances