. 2010 Dec 21;107(51):22278-83.
doi: 10.1073/pnas.0914064107. Epub 2010 Dec 6.

MHC class I modulates NMDA receptor function and AMPA receptor trafficking

Affiliations

MHC class I modulates NMDA receptor function and AMPA receptor trafficking

Lawrence Fourgeaud et al. Proc Natl Acad Sci U S A. .

Abstract

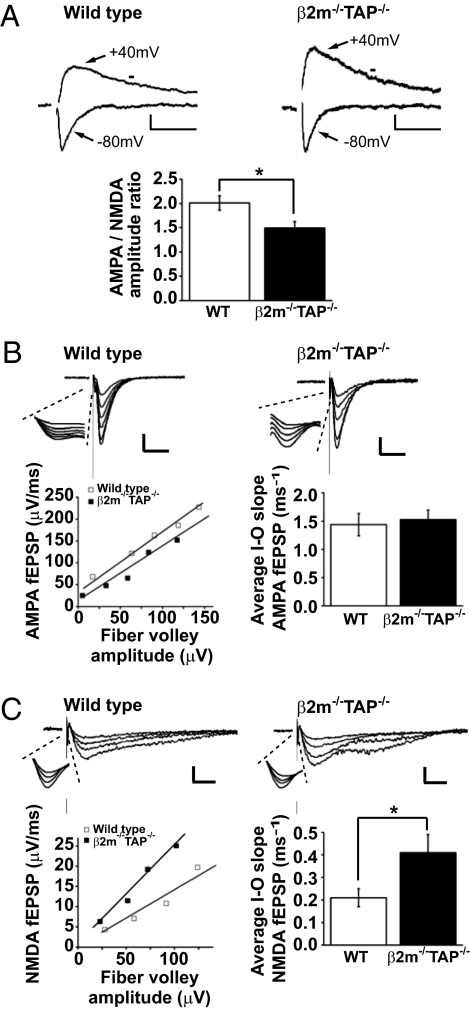
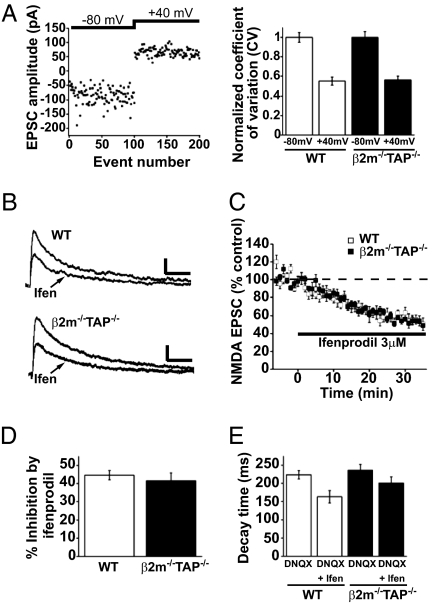
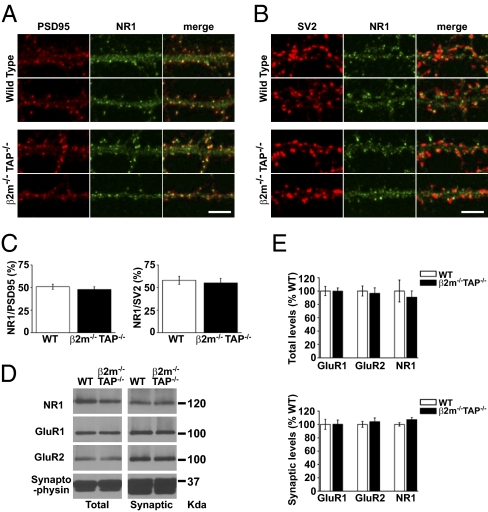
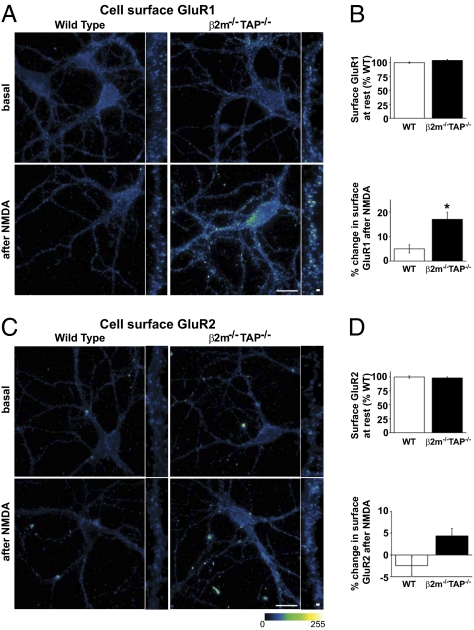
Proteins of the major histocompatibility complex class I (MHCI) are known for their role in immunity and have recently been implicated in long-term plasticity of excitatory synaptic transmission. However, the mechanisms by which MHCI influences synaptic plasticity remain unknown. Here we show that endogenous MHCI regulates synaptic responses mediated by NMDA-type glutamate receptors (NMDARs) in the mammalian central nervous system (CNS). The AMPA/NMDA ratio is decreased at MHCI-deficient hippocampal synapses, reflecting an increase in NMDAR-mediated currents. This enhanced NMDAR response is not associated with changes in the levels, subunit composition, or gross subcellular distribution of NMDARs. Increased NMDAR-mediated currents in MHCI-deficient neurons are associated with characteristic changes in AMPA receptor trafficking in response to NMDAR activation. Thus, endogenous MHCI tonically inhibits NMDAR function and controls downstream NMDAR-induced AMPA receptor trafficking during the expression of plasticity.


Conflict of interest statement

The authors declare no conflict of interest.

Figures

Fig. 1.
Fig. 1.
Increased NMDAR-mediated responses in β2m−/−TAP−/− hippocampal slice. (A Upper) Representative EPSCs recorded from individual CA1 pyramidal neurons voltage-clamped at −80 mV or +40 mV. NMDAR-mediated currents were measured at the time marked with horizontal bar. (Scale bar: WT, 20 pA/50 ms; β2m−/−TAP−/−, 10 pA/50 ms.) (Lower) Mean AMPA/NMDA ratio in CA1 neurons is significantly decreased in β2m−/−TAP−/− animals. (B Upper) Representative AMPAR-mediated fEPSPs recorded in D-(−)-2-Amino-5-phosphonopentanoic acid (D-APV) from CA1 dendrites in WT or β2m−/−TAP−/− hippocampal slices. (Scale bar: WT, 0.2 mV/20 ms; β2m−/−TAP−/−, 0.1 mV/20 ms.) (Insets) Magnified view of the fiber volley. (Lower Left) I/O relationship of the AMPAR-mediated responses in the examples above. (Lower Right) Summary graph showing mean AMPAR-mediated I/O slopes (WT, n = 8 animals; β2m−/−TAP−/−, n = 8 animals). (C Upper) Representative NMDAR-mediated fEPSPs recorded in 6,7-dinitroquinoxaline-2,3-dione (DNQX) from CA1 dendrites in WT or β2m−/−TAP−/− hippocampal slices. (Scale bar: 0.1 mV/20 ms.) (Insets) Magnified view of the fiber volley. (Lower Left) I/O relationship of the NMDAR-mediated responses in the examples above. (Lower Right) Summary graph showing mean NMDAR-mediated I/O slopes (for values, see text).
Fig. 2.
Fig. 2.
Normal proportions of silent synapses and NR2B-containing NMDARs in β2m−/−TAP−/− hippocampal neurons. (A Left) Sample plot of EPSC amplitudes for individual consecutive events recorded from a WT CA1 neuron voltage-clamped at −80 mV and then shifted to +40 mV. (Right) Summary graph showing the mean CV of EPSCs at −80 mV and +40 mV, normalized to the CV at −80 mV (WT n = 9 cells; β2m−/−TAP−/− n = 8 cells). (B) Representative NMDAR-mediated EPSCs recorded from individual WT (Upper) or β2m−/−TAP−/− (Lower) CA1 neurons 6 min before or 30 min after application of ifenprodil. (Scale bar: 20 pA/100 ms.) (C) Averaged NMDAR-mediated EPSCs recorded before and during bath application of 3 μM ifenprodil, normalized to a 6-min baseline (WT n = 7 cells; β2m−/−TAP−/− n = 8 cells). (D) Mean percentage inhibition of the normalized NMDAR-mediated EPSC amplitude by ifenprodil. (E) Mean decay time of the NMDAR-mediated EPSC measured 6 min before or 30 min after application of ifenprodil.
Fig. 3.
Fig. 3.
Total and synaptic levels of NR1, GluR1, and GluR2 are not increased in β2m−/−TAP−/− hippocampal neurons. (A) Representative NR1 and PSD-95 double-label immunostaining in straightened proximal dendrites from WT and β2m−/−TAP−/− hippocampal neurons in culture. (Scale bar: 5 μm.) (B) Representative NR1 and SV2 double-label immunostaining in straightened proximal dendrites from WT and β2m−/−TAP−/−hippocampal neurons in culture. (Scale bar: 5 μm.) (C) Mean percentage of NR1 puncta colocalizing with PSD-95 puncta (Left; WT n = 12 cells; β2m−/−TAP−/− n = 13 cells) or SV2 puncta (Right; WT n = 11 cells; β2m−/−TAP−/− n = 12 cells) in WT versus β2m−/−TAP−/− hippocampal neurons in culture (two separate experiments). Colocalization was defined as contact between puncta at the light level, and therefore includes closely apposed as well as extensively overlapping puncta. (D) Representative Western blot of total (S1) and synaptic plasma membrane–enriched (P3) fractions from WT and β2m−/−TAP−/− mouse hippocampi probed for NR1, GluR1, GluR2, and synaptophysin. (E) Total (Upper) or synaptic (Lower) levels of GluR1, GluR2, and NR1 in samples from four WT and four β2m−/−TAP−/− animals, normalized to synaptophysin and represented as percentage of WT.
Fig. 4.
Fig. 4.
NMDA increases cell-surface GluR1 levels in β2m−/−TAP−/− neurons. (A) Representative pseudocolored cell-surface GluR1 immunostaining in WT and β2m−/−TAP−/− hippocampal neurons in culture at rest (basal) or 12 min after NMDA treatment. (Scale bar: 20 μm; high magnification: 1 μm.) (B) Quantification of dendritic cell-surface GluR1 labeling (four separate experiments). (Upper) Pooled data at rest. (Lower) Significant increase in cell-surface GluR1 labeling after NMDA treatment in β2m−/−TAP−/− animals. (C) Representative pseudocolored cell-surface GluR2 immunostaining in WT and β2m−/−TAP−/− hippocampal neurons in culture at rest (basal) or 12 min after NMDA treatment. (Scale bar: 20 μm; high magnification: 1 μm.) (D) Quantification of dendritic cell-surface GluR2 labeling (four separate experiments). (Upper) Pooled data at rest. (Lower) Change in surface GluR2 after NMDA treatment (WT n = 42 cells; β2m−/−TAP−/− n = 38 cells).

References

    1. Boulanger LM, Shatz CJ. Immune signalling in neural development, synaptic plasticity and disease. Nat Rev Neurosci. 2004;5:521–531. - PubMed
    1. Fourgeaud L, Boulanger LM. Role of immune molecules in the establishment and plasticity of glutamatergic synapses. Eur J Neurosci. 2010;32:207–217. - PubMed
    1. Corriveau RA, Huh GS, Shatz CJ. Regulation of class I MHC gene expression in the developing and mature CNS by neural activity. Neuron. 1998;21:505–520. - PubMed
    1. Huh GS, et al. Functional requirement for class I MHC in CNS development and plasticity. Science. 2000;290:2155–2159. - PMC - PubMed
    1. Lidman O, Olsson T, Piehl F. Expression of nonclassical MHC class I (RT1-U) in certain neuronal populations of the central nervous system. Eur J Neurosci. 1999;11:4468–4472. - PubMed

Publication types

MeSH terms

Substances