. 2011 Feb;68(2):280-89; discussion 290.
doi: 10.1227/NEU.0b013e3181ff9cbb.

Development of stereotactic mass spectrometry for brain tumor surgery

Affiliations

Development of stereotactic mass spectrometry for brain tumor surgery

Nathalie Y R Agar et al. Neurosurgery. 2011 Feb.

Abstract

Background: Surgery remains the first and most important treatment modality for the majority of solid tumors. Across a range of brain tumor types and grades, postoperative residual tumor has a great impact on prognosis. The principal challenge and objective of neurosurgical intervention is therefore to maximize tumor resection while minimizing the potential for neurological deficit by preserving critical tissue.

Objective: To introduce the integration of desorption electrospray ionization mass spectrometry into surgery for in vivo molecular tissue characterization and intraoperative definition of tumor boundaries without systemic injection of contrast agents.

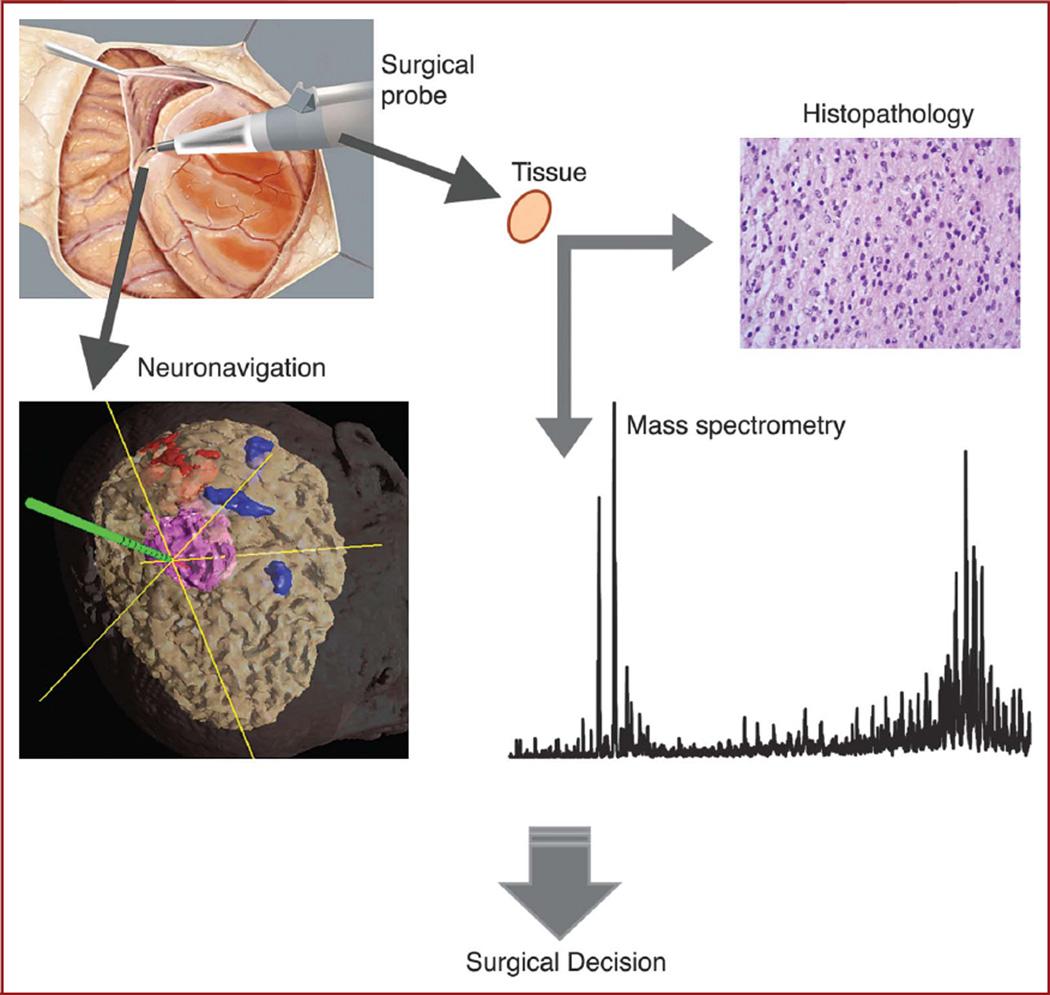
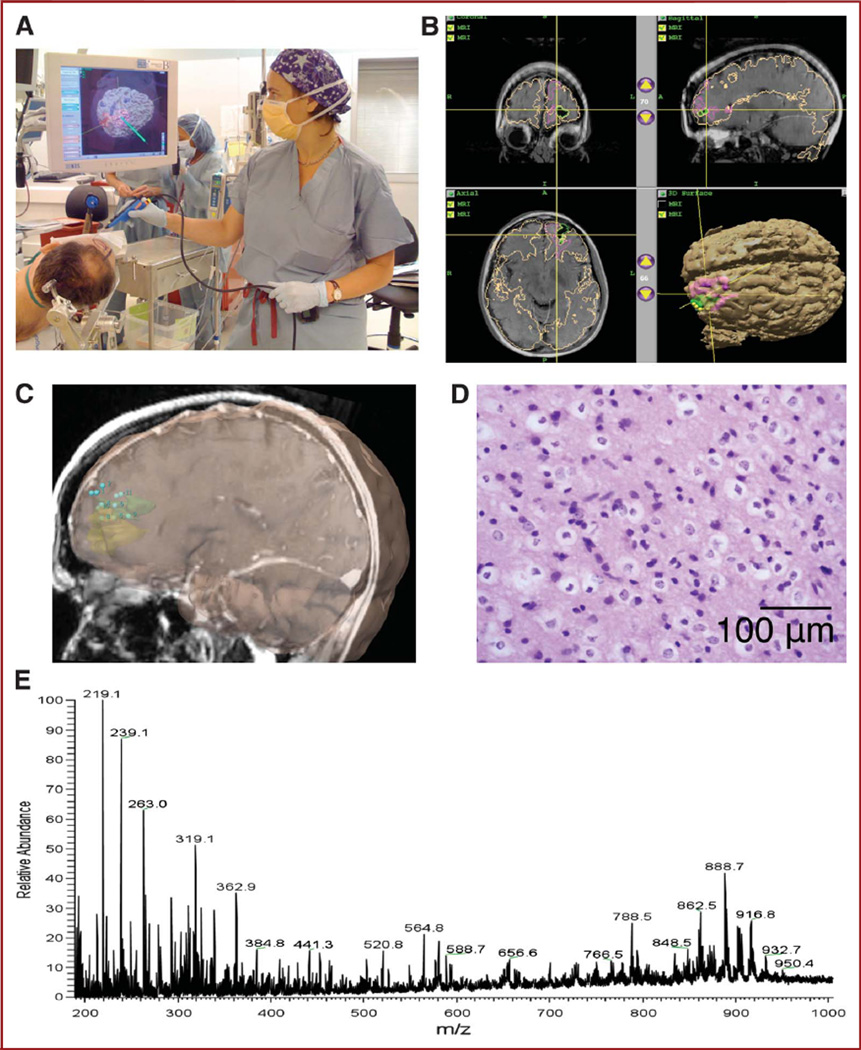
Methods: Using a frameless stereotactic sampling approach and by integrating a 3-dimensional navigation system with an ultrasonic surgical probe, we obtained image-registered surgical specimens. The samples were analyzed with ambient desorption/ionization mass spectrometry and validated against standard histopathology. This new approach will enable neurosurgeons to detect tumor infiltration of the normal brain intraoperatively with mass spectrometry and to obtain spatially resolved molecular tissue characterization without any exogenous agent and with high sensitivity and specificity.

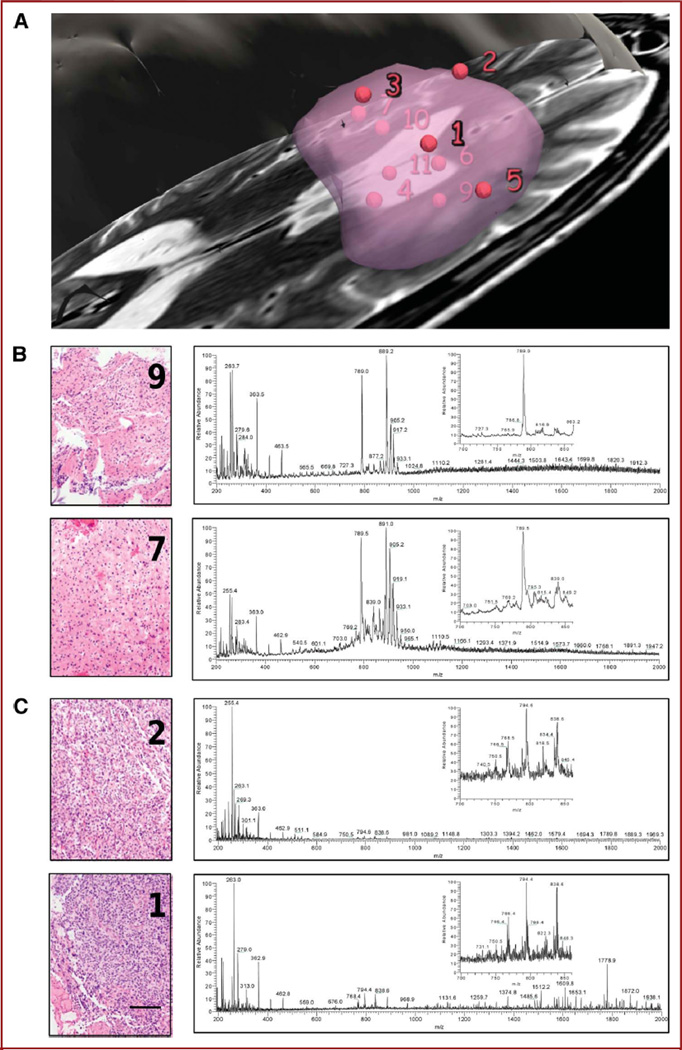
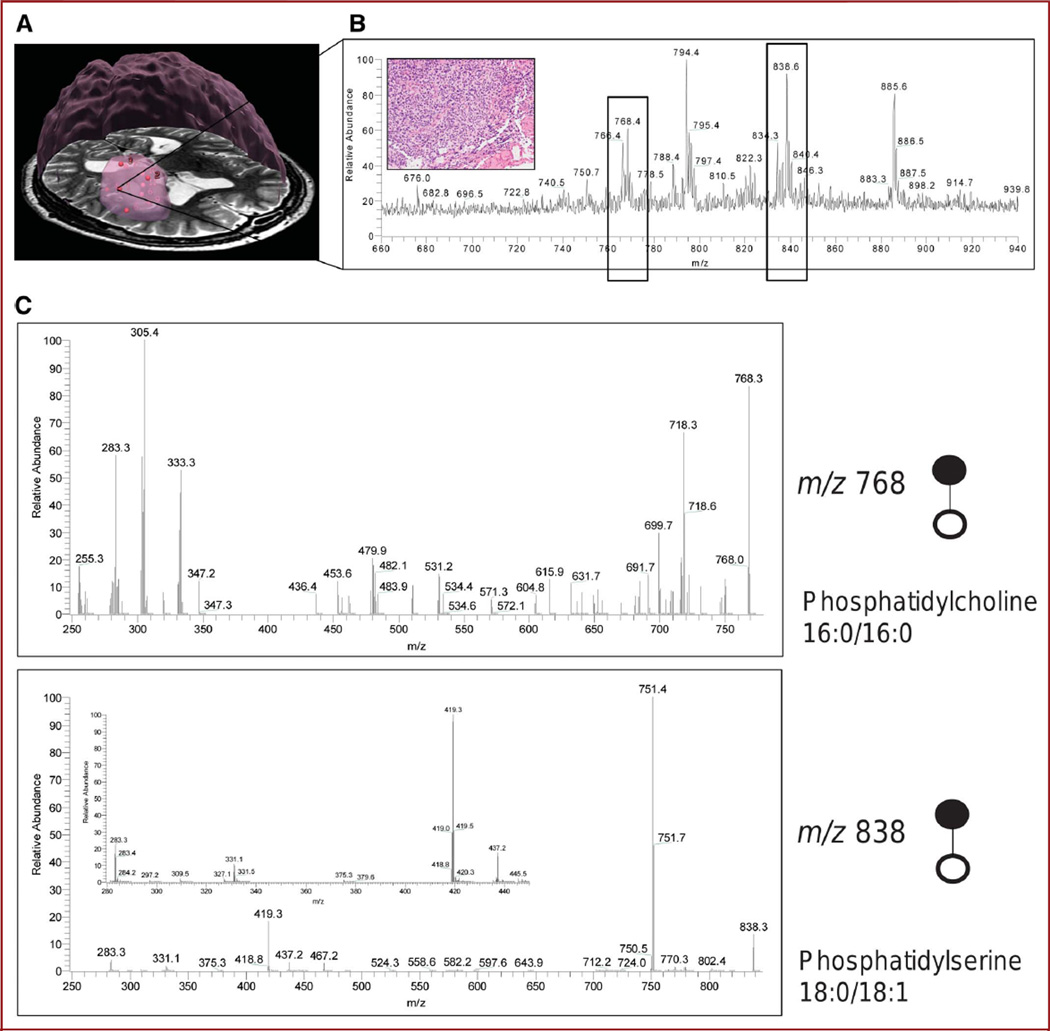
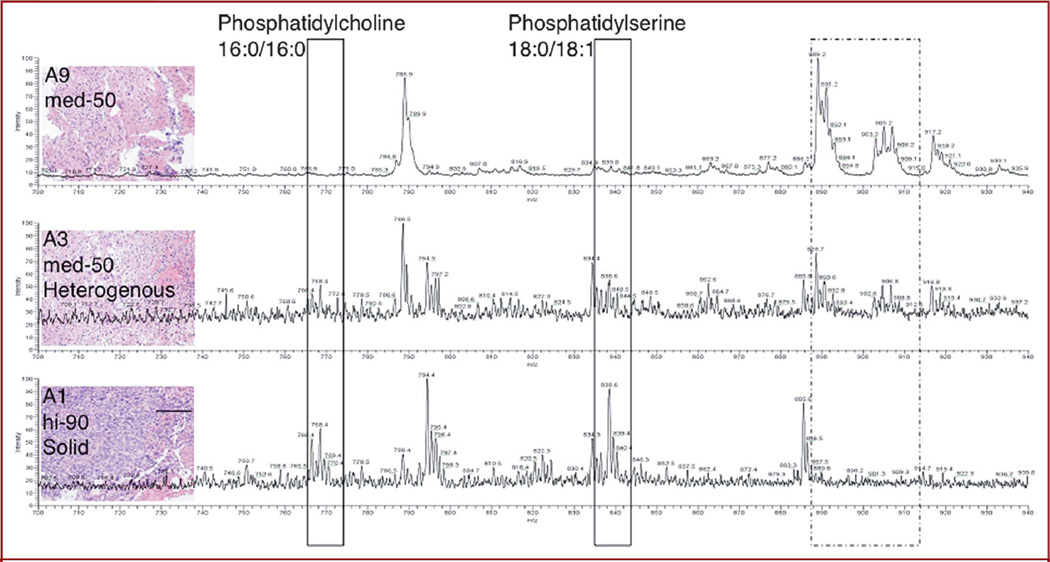
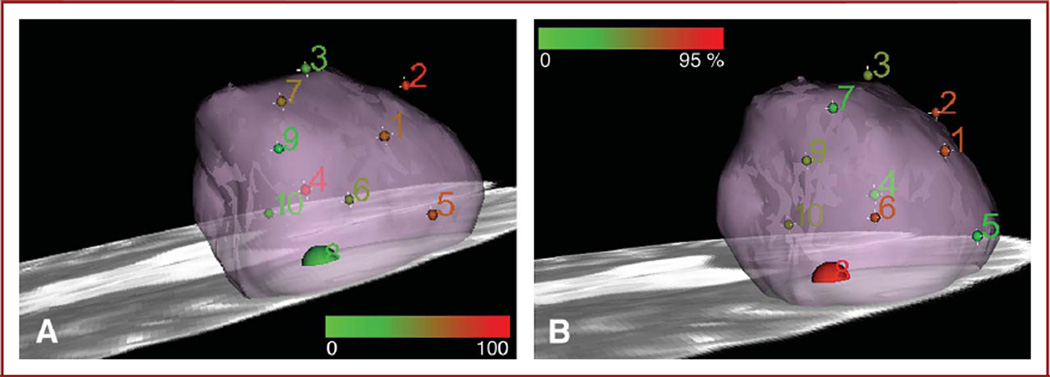
Results: Proof of concept is presented in using mass spectrometry intraoperatively for real-time measurement of molecular structure and using that tissue characterization method to detect tumor boundaries. Multiple sampling sites within the tumor mass were defined for a patient with a recurrent left frontal oligodendroglioma, World Health Organization grade II with chromosome 1p/19q codeletion, and mass spectrometry data indicated a correlation between lipid constitution and tumor cell prevalence.

Conclusion: The mass spectrometry measurements reflect a complex molecular structure and are integrated with frameless stereotaxy and imaging, providing 3-dimensional molecular imaging without systemic injection of any agents, which can be implemented for surgical margins delineation of any organ and with a rapidity that allows real-time analysis.


Figures

FIGURE 1
FIGURE 1
Intraoperative mass spectrometry for identification of tumor margins. The approach is validated by correlation of ambient mass spectrometry analysis of tissue specimens with histopathological evaluation. Both types of analysis of stereotactically resected specimens are additionally correlated to preoperative radiological presentation of the lesion by digital identification of each sampling location with the navigation system.
FIGURE 2
FIGURE 2
Workflow. A, positioning and calibration of navigation probe. B, navigation with preoperative functional magnetic resonance imaging with colored overlays indicating tumor and eloquent cortex (by functional magnetic resonance imaging). C, digital registration of stereotactic sampling of the tumor bed. D, histopathology evaluation of Cavitron Ultrasonic Surgical Aspirator (CUSA) specimen with hematoxylin and eosin staining. Preservation of cellularity with the CUSA surgical probe is represented. E, direct desorption electrospray ionization mass spectrometry analysis of specimen.
FIGURE 3
FIGURE 3
Case analysis. A, view of sampling sites relative to manually segmented tumor. Each specimen was analyzed by mass spectrometry using a desorption electrospray ionization source combined with a linear trap mass analyzer. B, corresponding spectra for negative ions are shown for specimens of infiltrative tumor region (9 and 7), together with histopathological evaluation and 50% and 30% tumor cell concentration, respectively. C, analysis of high cell density (2 and 1) specimens with 90% tumor cell concentration. Portions of the mass spectra are enlarged (inset). Scale bar represents 100 µm.
FIGURE 4
FIGURE 4
Direct identification of molecules with in vivo stereotactic coordinates. A, three-dimensional rendering of the tumor from preoperative magnetic resonance image with sampling positions represented by red spheres. The bulk of the tumor is represented by a large, roughly spherical volume. B, a region of spectral differences for this highly cellular specimen (inset) was further analyzed to identify molecules contributing to tissue distinction. Two negative ions represented by peaks (boxed) at m/z 768 and 838 were subjected to tandem mass spectrometry with collision-induced dissociation. C, fragmentation patterns for the 2 negative ions of interest at m/z 768.3 and 838.6 correspond to phosphatidylcholine 16:0/16:0 and phosphatidylserine 18:0/18:1
FIGURE 5
FIGURE 5
Correlation between molecular and histopathological changes. Qualitative correlation of different phospholipid proportions with histological evaluation of tumor cell prevalence for compared specimens. Scale bar represents 100 µm.
FIGURE 6
FIGURE 6
A 3-dimensional rendering of mass spectrometry data and histopathology scoring. The size of the spheres is to scale to represent the approximate size of each specimen and corresponding theoretical sampling error from the navigation system, without accounting for inherent imaging error and brain shift. Small spheres are 2.0 mm in radius; larger sphere for specimen 8 is 5.0-mm radius (4-mm radius specimen and 1.0-mm radius sampling error). A, Distribution of m/z 768.3 ± 0.5 tentatively assigned to phosphatidylcholine 16:0/16:0 in tumor; for specimen 8, the mean of the signals from A and B was taken. Color scale corresponds to a 0 to 100 relative intensity in the m/z 600 to 1000 range. B, color map corresponding to tumor cell concentration as evaluated by neuropathologist on hematoxylin and eosin–stained permanent sections. Color scale corresponds to 0% to 95% tumor cell concentration.

References

    1. Cha S. Update on brain tumor imaging. Curr Neurol Neurosci Rep. 2005;5(3):169–177. - PubMed
    1. Yip S, Iafrate AJ, Louis DN. Molecular diagnostic testing in malignant gliomas: a practical update on predictive markers. J Neuropathol Exp Neurol. 2008;67(1):1–15. - PubMed
    1. Furnari FB, Fenton T, Bachoo RM, et al. Malignant astrocytic glioma: genetics, biology, and paths to treatment. Genes Dev. 2007;21(21):2683–2710. - PubMed
    1. Philippon JH, Clemenceau SH, Fauchon FH, Foncin JF. Supratentorial low-grade astrocytomas in adults. Neurosurgery. 1993;32(4):554–559. - PubMed
    1. Janny P, Cure H, Mohr M, et al. Low grade supratentorial astrocytomas: management and prognostic factors. Cancer. 1994;73(7):1937–1945. - PubMed

Publication types