. 2011 Mar;121(3):327-35.
doi: 10.1007/s00401-010-0787-6. Epub 2010 Dec 7.

In vivo multiphoton imaging reveals gradual growth of newborn amyloid plaques over weeks

Affiliations

In vivo multiphoton imaging reveals gradual growth of newborn amyloid plaques over weeks

Steffen Burgold et al. Acta Neuropathol. 2011 Mar.

Abstract

The kinetics of amyloid plaque formation and growth as one of the characteristic hallmarks of Alzheimer's disease (AD) are fundamental issues in AD research. Especially the question how fast amyloid plaques grow to their final size after they are born remains controversial. By long-term two-photon in vivo imaging we monitored individual methoxy-X04-stained amyloid plaques over 6 weeks in 12 and 18 months old Tg2576 mice. We found that in 12 months old mice, newly appearing amyloid plaques were initially small in volume and subsequently grew over time. The growth rate of plaques was inversely proportional to their volume; thus amyloid plaques that were already present at the first imaging time point grew over time but slower compared to new plaques. Additionally, we analyzed 18 months old Tg2576 mice in which we neither found newly appearing plaques nor a significant growth of pre-existing plaques over 6 weeks of imaging. In conclusion, newly appearing amyloid plaques are initially small in size but grow over time until plaque growth can not be detected anymore in aged mice. These results suggest that drugs that target plaque formation should be most effective early in the disease, when plaques are growing.


Figures

Fig. 1
Fig. 1
Long-term two-photon in vivo imaging of amyloid plaques. a Schematic of a cranial window implanted over the somatosensory cortex of a Tg2576 mouse that was crossed with YFP-H. A volume rendered z-stack with perspective view (45°) shows amyloid plaques in blue (stained with methoxy-X04) and YFP-labeled dendrites in green at week 0 which was the first imaging time point. Amyloid plaques were followed over 6 weeks with weekly imaging time points illustrated as maximum intensity projections. b Illustration of the image analysis with Imaris software. After the amyloid plaques in the raw images were 3D surface rendered, the software automatically calculated the plaque volume which was then color-coded. Major ticks show 50 μm
Fig. 2
Fig. 2
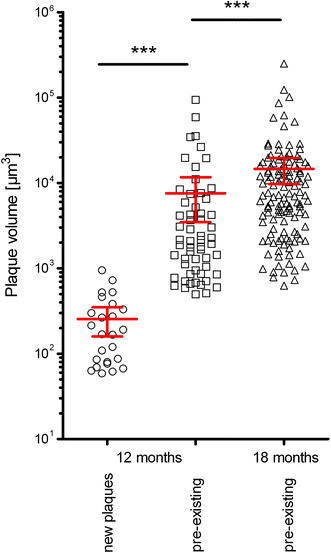
Distribution of amyloid plaque volumes. Distribution of amyloid plaque volumes between individual newborn (n = 25) and pre-existing plaques (n = 58) in 12 months old Tg2576 and pre-existing plaques (n = 128) at 18 months of age. The red bars show mean and 95% CI. ***P < 0.001 (Kruskal–Wallis test with Dunn’s post-hoc test)
Fig. 3
Fig. 3
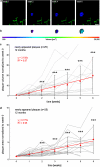
Growth of newborn amyloid plaques in 12 months old Tg2576. a Maximum intensity projections of a time series of 3D images acquired with two-photon in vivo imaging in 12 months old Tg2576 mice. A newborn amyloid plaque (stained with methoxy-X04) is displayed in blue and YFP-labeled dendrites in green. This newborn plaque is not apparent at week 0 but emerges at week 2. b In the following weeks, the nascent plaque considerably increased in size indicated by color-coded surface rendered objects. c The diagram shows normalized volumes of 25 individual newborn plaques (grey lines) based on the volume of first appearance. Week 0 is set as the time-point of first appearance. Average plaque volumes (red triangles), and linear regression of average plaque volume (red line) over 6 weeks are displayed. d The diagram shows normalized areas of 25 individual newborn plaques (grey lines) based on the area of first appearance. Week 0 is set as the time-point of first appearance. Average plaque areas (red triangles), and linear regression of average plaque volume (red line) over 6 weeks are displayed. Error bars show standard deviation. ***P < 0.001; Scale bars show 10 μm
Fig. 4
Fig. 4
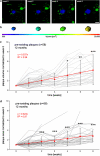
Growth of pre-existing amyloid plaques in 12 months old Tg2576. a Maximum intensity projections of a time series of 3D images acquired with two-photon in vivo imaging in 12 months old Tg2576 mice. A pre-existing amyloid plaque (stained with methoxy-X04) is displayed in blue and YFP-labeled dendrites in green. This plaque is already apparent at week 0. b In the following weeks, the plaque considerably increased in size indicated by color-coded surface rendered objects. c The diagram shows normalized volumes of 58 individual plaques (grey lines) based on the volume at the first imaging time-point (week 0). Average plaque volumes (red triangles), and linear regression of average plaque volume (red line) over 6 weeks are displayed. d The diagram shows normalized areas of 58 individual plaques (grey lines) based on the volume at the first imaging time-point (week 0). Average plaque areas (red triangles), and linear regression of average plaque area (red line) over 6 weeks are displayed. Error bars show standard deviation. *P < 0.05, **P < 0.01, ***P < 0.001; Scale bars show 10 μm
Fig. 5
Fig. 5
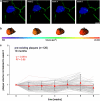
Growth of pre-existing amyloid plaques in 18 months old Tg2576. a Maximum intensity projections of a time series of 3D images acquired with two-photon in vivo imaging in 18 months old Tg2576 mice. A pre-existing amyloid plaque (stained with methoxy-X04) is displayed in blue and YFP-labeled dendrites in green. This plaque is already apparent at week 0. b In the following weeks, the plaque does not increased in size indicated by color-coded surface rendered objects. c The diagram shows normalized volumes of 126 individual plaques (grey lines) based on the volume at the first imaging time-point (week 0). Average plaque volumes (red triangles), and linear regression of average plaque volume (red line) over 6 weeks are displayed. Error bars show standard deviation. Scale bars show 10 μm
Fig. 6
Fig. 6
Relationship between growth and initial volume of amyloid plaques. The growth of amyloid plaques is quantified as the slope of a linear fit of the normalized volumes measured at each time point and is shown as a function of the initial volume of plaques. a Data from 12 months old animals. Newborn plaques are shown in blue and pre-existing plaques in red. b Data from 18 months old animals. No newborn plaques were detected at that age. Pre-existing plaques are shown in red

References

    1. Bittner T, Fuhrmann M, Burgold S, et al. gamma-Secretase inhibition reduces spine density in vivo via an amyloid precursor protein-dependent pathway. J Neurosci. 2009;29:10405–10409. doi: 10.1523/JNEUROSCI.2288-09.2009. - DOI - PMC - PubMed
    1. Bolmont T, Haiss F, Eicke D, et al. Dynamics of the microglial/amyloid interaction indicate a role in plaque maintenance. J Neurosci. 2008;28:4283–4292. doi: 10.1523/JNEUROSCI.4814-07.2008. - DOI - PMC - PubMed
    1. Christie RH, Bacskai BJ, Zipfel WR, et al. Growth arrest of individual senile plaques in a model of Alzheimer’s disease observed by in vivo multiphoton microscopy. J Neurosci. 2001;21:858–864. - PMC - PubMed
    1. Esler WP, Stimson ER, Ghilardi JR, et al. In vitro growth of Alzheimer’s disease beta-amyloid plaques displays first-order kinetics. Biochemistry. 1996;35:749–757. doi: 10.1021/bi951685w. - DOI - PubMed
    1. Feng G, Mellor RH, Bernstein M, et al. Imaging neuronal subsets in transgenic mice expressing multiple spectral variants of GFP. Neuron. 2000;28:41–51. doi: 10.1016/S0896-6273(00)00084-2. - DOI - PubMed

Publication types