. 2011 Feb 25;286(8):6650-8.
doi: 10.1074/jbc.M110.191627. Epub 2010 Dec 7.

Targeted in vivo O-GlcNAc sensors reveal discrete compartment-specific dynamics during signal transduction

Affiliations

Targeted in vivo O-GlcNAc sensors reveal discrete compartment-specific dynamics during signal transduction

Luz D Carrillo et al. J Biol Chem. .

Abstract

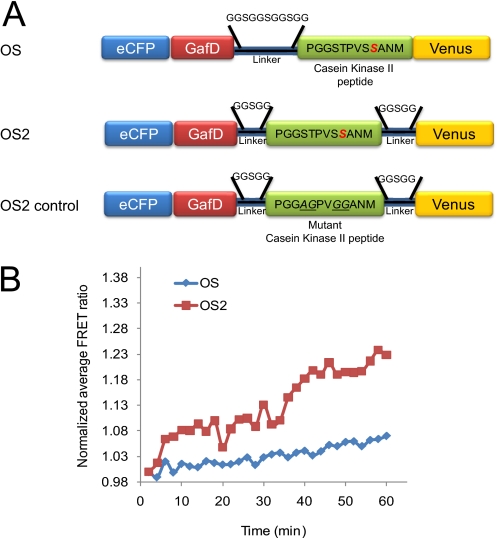
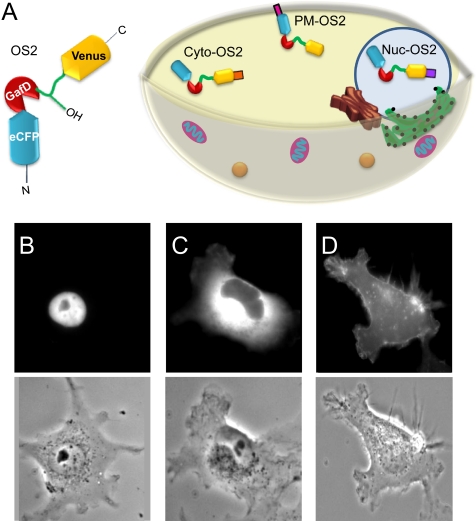
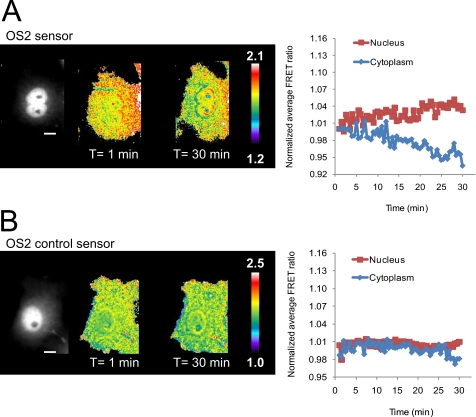
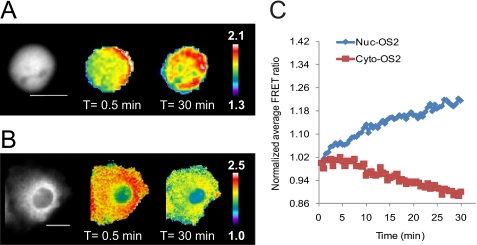
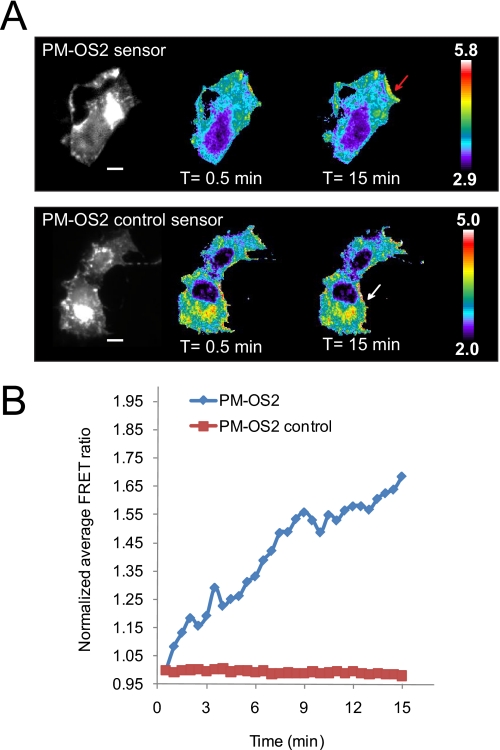
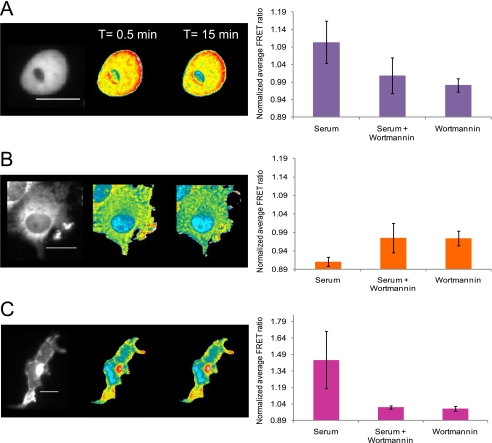
β-O-N-acetyl-D-glucosamine (O-GlcNAc) is a post-translational modification involved in a plethora of biological systems ranging from cellular stress to insulin signaling. This modification shares many hallmarks with phosphorylation, including its dynamic cycling onto a host of proteins such as transcription factors, kinases, and phosphatases, and regulation of cellular functions, including cell signaling. Herein, we report the development of an improved genetically based O-GlcNAc FRET sensor and compartmentalized targeted variants for the characterization of the spatiotemporal dynamics of O-GlcNAc. During serum-stimulated signal transduction, rapid increases in O-GlcNAc activity were observed at both the plasma membrane and the nucleus, with a concomitant decrease detected in the cytoplasm. These findings suggest the existence of compartment specific dynamics for O-GlcNAc in response to signal-inducing stimuli, pointing to complex regulation of this modification. In addition, inhibition of the PI3K pathway by wortmannin abolished the O-GlcNAc response, suggesting that the activity observed is modulated downstream of the PI3K pathway. Taken together, our data argues that O-GlcNAc is a rapidly induced component of signaling and that the interplay between O-GlcNAc and kinase signaling may be more akin to the complex relationship between kinase pathways.


Figures

FIGURE 1.
FIGURE 1.
Characterization and comparison of the O-GlcNAc FRET-based sensors OS and OS2. A, schematic of the O-GlcNAc reporters OS, OS2, and OS2 control. The O-GlcNAc sensors were composed of an enhanced CFP (eCFP) fused to the fimbrial adhesin lectin domain GafD (19, 20), a known substrate peptide domain for O-GlcNAc from casein kinase II and a variant of the yellow fluorescent protein; Venus. The OS2 sensor incorporates two shorter linker regions, one on each side of the substrate domain, in lieu of the single linker region between the GafD and the substrate in the original O-GlcNAc sensor, OS. The OS2 control sensor does not contain serine or threonine residues in the casein kinase II substrate domain. B, HeLa cells were transfected with OS and OS2 and ratiometric FRET measurements were quantified for 60 min immediately following the addition of PUGNAc (100 μm) and glucosamine (4 mm). The OS2 sensor displays a higher dynamic range than the OS sensor. The graph is representative of the three independent experiments.
FIGURE 2.
FIGURE 2.
Compartmentalization of the OS2 reporter. A, schematic representation of the targeted OS2 sensors. B, the nuclear-localized OS2 sensor (Nuc-OS2) was created by fusing the C terminus of OS2 with a nuclear localization sequence derived from the simian virus 40 large T-antigen. C, Cyto-OS2 was generated by fusion of a nuclear exclusion peptide from the HIV-1 Rev protein to the C terminus of OS2. D, the plasma membrane sensor (PM-OS2) contains a peptide sequence from Lyn kinase with both a myristoylation and palmitoylation site fused to the N terminus of the OS2 sensor. eCFP, enhanced CFP.
FIGURE 3.
FIGURE 3.
O-GlcNAc response during serum stimulation in Cos7 cells. Cos7 cells expressing OS2 or OS2 control sensor were serum starved (16–20 h) and placed in imaging media (HBSS). Upon treatment with serum (10% FBS in HBSS), cells were monitored for 30 min (supplemental Movies 1 and 2, respectively). The monochrome image represents the YFP channel and shows the distribution of the reporter in the cell. A, FRET response of Cos7 cells transfected with the OS2 sensor. Pseudocolor images depict an increase in FRET in the nucleus and a slight decrease in the cytoplasm. The normalized average FRET ratio for this cell was plotted in a time course. The scale bar represents 30 μm. The color bar represents the FRET ratio values. B, FRET response of the OS2 control sensor. No change in FRET can be observed in either compartment upon treatment with serum. The graph on the right represents the normalized average FRET ratio for this cell over time. Data is representative of ∼5–7 cells.
FIGURE 4.
FIGURE 4.
Visualization of nuclear and cytoplasm-specific O-GlcNAc activity in Cos7 cells upon serum stimulation. Cos7 cells expressing Nuc-OS2 or Cyto-OS2 sensor were treated as in Fig. 3 and imaged for 30 min after serum stimulation (supplemental Movies 3 and 4, respectively). The far left image represents the YFP channel monochrome image. A, Cos7 cells transfected with the Nuc-OS2 sensor displayed an increase in FRET over the 30-min time frame. B, Cos7 cells transfected with the Cyto-OS2 sensor showed a clear decrease in FRET over time. The scale bar represents 20 μm for both the Nuc-OS2 sensor (A) and Cyto-OS2 (B) sensors. The color bar represents the FRET ratio values. C, graph of the normalized average FRET ratio over time for cells shown in A and B. Nuc-OS2 data is shown in blue, and the Cyto-OS2 data is visualized in red. Data are representative for a minimum of three cells from independent experiments.
FIGURE 5.
FIGURE 5.
Plasma membrane targeted OS2 sensor reveals localized microdomains of O-GlcNAc activity. Serum-starved Cos7 cells transfected with either PM-OS2 or PM-OS2-control were treated with serum as before and their corresponding FRET changes were quantified (supplemental Movies 5 and 6, respectively). The regions utilized for the analysis of the FRET changes are labeled with arrows. A, upon serum stimulation, increases in FRET were observed within localized regions of the plasma membrane (red arrow). Overall, no change was observed in the plasma membrane of cells overexpressing the PM-OS2 control sensor (white arrow). The scale bar represents 30 μm for both PM-OS2 and PM-OS2 control sensors. The color bar represents the FRET ratio values. B, graphical representation of A. Data shown are representative of a minimum of three cells from independent experiments.
FIGURE 6.
FIGURE 6.
Inhibition of the PI3K pathway by wortmannin abolishes O-GlcNAc dynamics in response to serum. Serum-starved Cos7 cells transfected with the either the nuclear, the cytoplasmic, or the plasma membrane targeted OS2 sensors were pretreated with wortmannin (100 nm) for 30 min followed by stimulation with serum as before (supplemental Movies 7, 8, and 9, respectively). The YFP channel image (far left) shows the distribution of the reporter in the cell. Changes in FRET response for serum-starved Cos7 cells treated with wortmannin and serum are illustrated by pseudocolor images. The color bar represents the FRET ratio values. The scale bar represents 20 μm for all sensors. The bar graphs at the right of the FRET images represent the average FRET response of the sensors for a select number of cells treated with either serum, serum and wortmannin, or wortmannin alone. A, Nuc-OS2 data. The bar graph at the right represents the average data of seven cells with the S.D. for each treatment condition. B, Cyto-OS2 data. The bar graph at the right represents the average data of three cells with the S.D. for each treatment condition. C, PM-OS2 data. The bar graph at the right represents the average data of three cells with the S.D. for each treatment condition.

References

    1. Yang X., Ongusaha P. P., Miles P. D., Havstad J. C., Zhang F., So W. V., Kudlow J. E., Michell R. H., Olefsky J. M., Field S. J., Evans R. M. (2008) Nature 451, 964–969 - PubMed
    1. Whelan S. A., Dias W. B., Thiruneelakantapillai L., Lane M. D., Hart G. W. (2010) J. Biol. Chem. 285, 5204–5211 - PMC - PubMed
    1. Love D. C., Ghosh S., Mondoux M. A., Fukushige T., Wang P., Wilson M. A., Iser W. B., Wolkow C. A., Krause M. W., Hanover J. A. (2010) Proc. Natl. Acad. Sci. U.S.A. 107, 7413–7418 - PMC - PubMed
    1. Nanashima N., Asano J., Hayakari M., Nakamura T., Nakano H., Yamada T., Shimizu T., Akita M., Fan Y., Tsuchida S. (2005) J. Biol. Chem. 280, 43010–43016 - PubMed
    1. Yang X., Su K., Roos M. D., Chang Q., Paterson A. J., Kudlow J. E. (2001) Proc. Natl. Acad. Sci. U.S.A. 98, 6611–6616 - PMC - PubMed

Publication types