. 2011 Mar 15;17(6):1351-61.
doi: 10.1158/1078-0432.CCR-10-1905. Epub 2010 Dec 7.

Reduced dose and intermittent treatment with lapatinib and trastuzumab for potent blockade of the HER pathway in HER2/neu-overexpressing breast tumor xenografts

Affiliations

Reduced dose and intermittent treatment with lapatinib and trastuzumab for potent blockade of the HER pathway in HER2/neu-overexpressing breast tumor xenografts

Mothaffar F Rimawi et al. Clin Cancer Res. .

Abstract

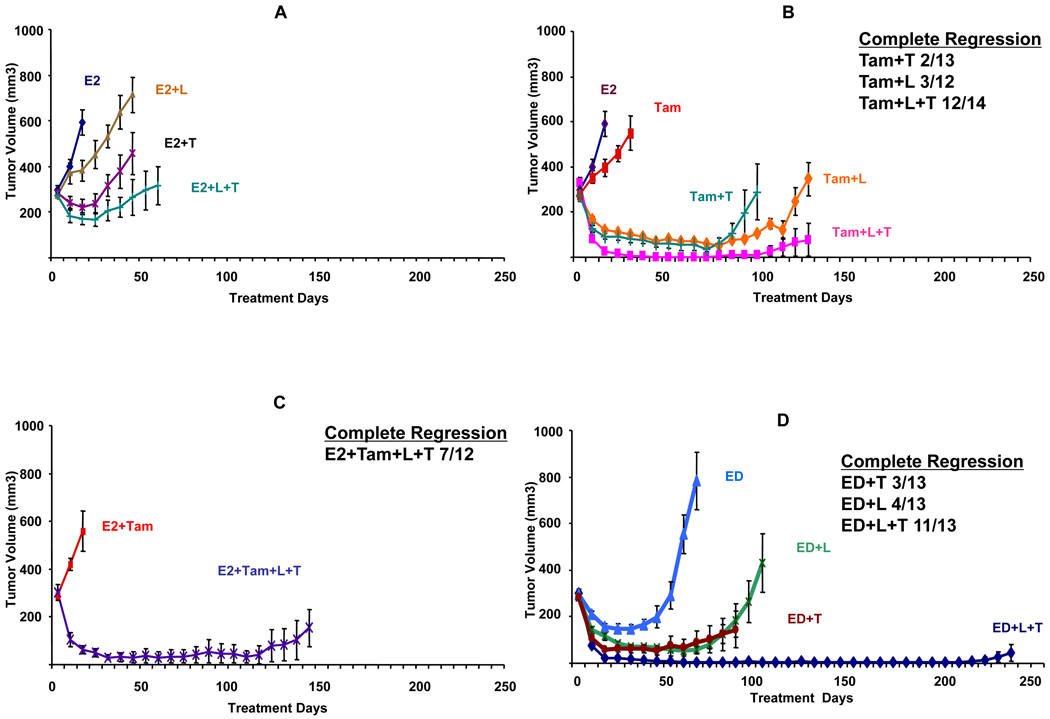
Purpose: We have shown that incomplete blockade of the human epidermal growth factor (HER) pathway is a mechanism of resistance to treatment with trastuzumab (T) in HER2-overexpressing tumor xenografts. We now investigate whether the addition of lapatinib (L), a dual HER1/2 kinase inhibitor, to T results in more potent inhibition of the pathway and therefore inhibition of tumor growth, and whether reduced dose and intermittent treatment with the combination is equally effective.

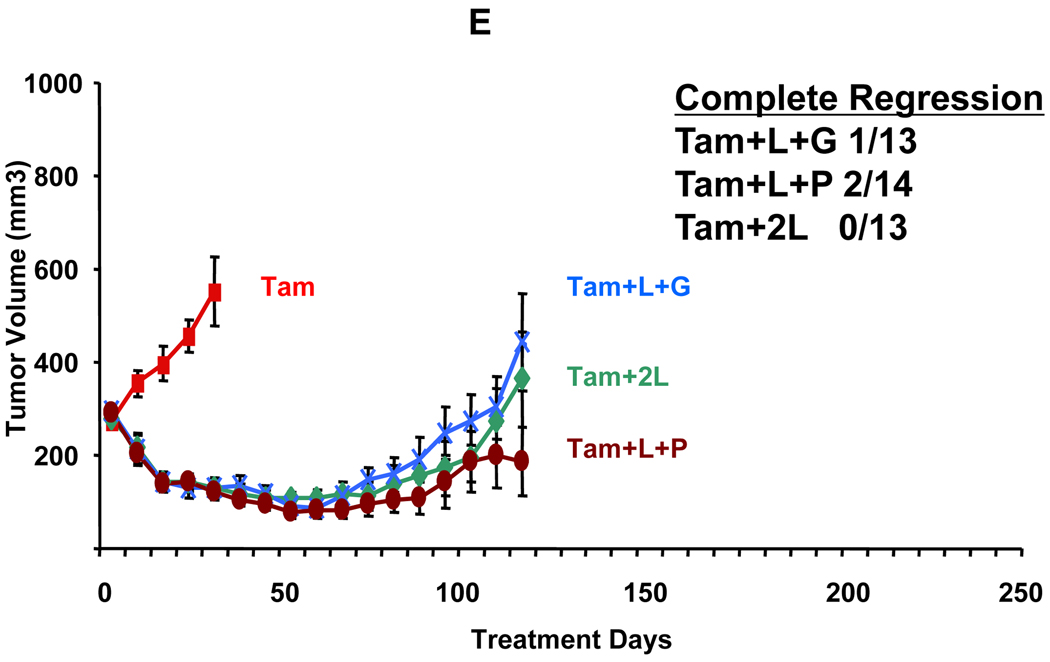
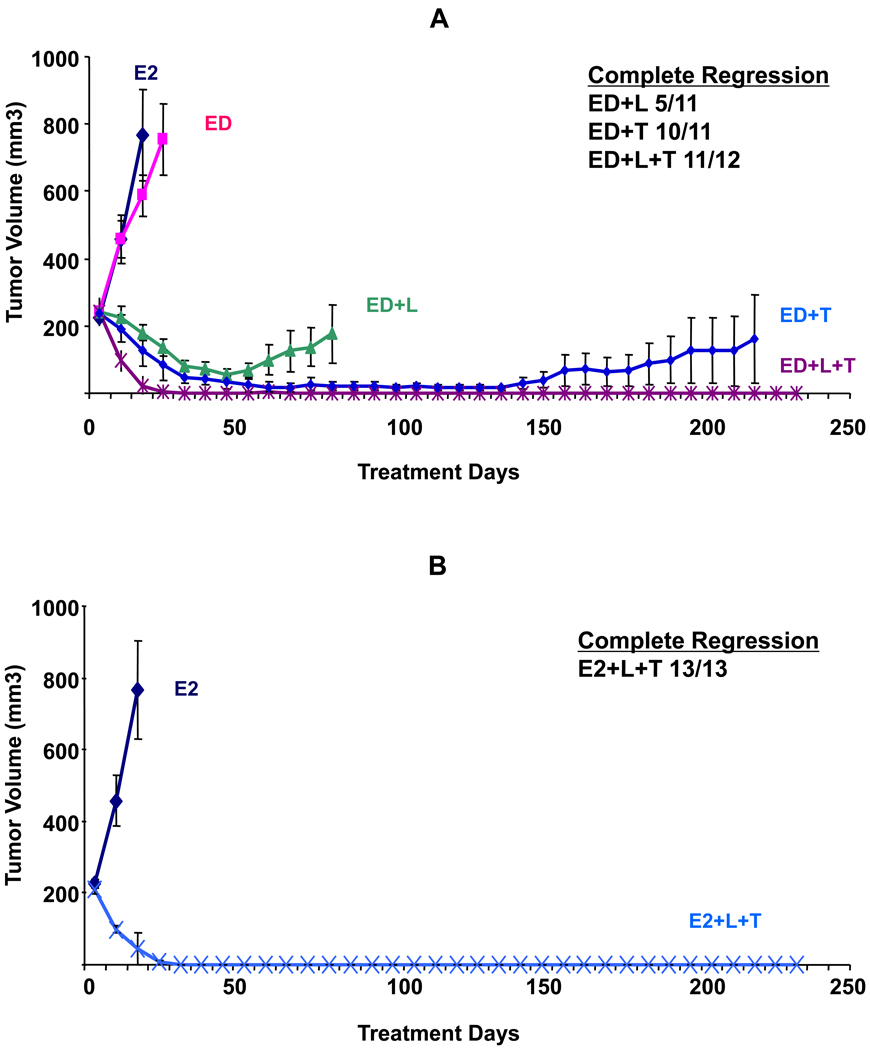
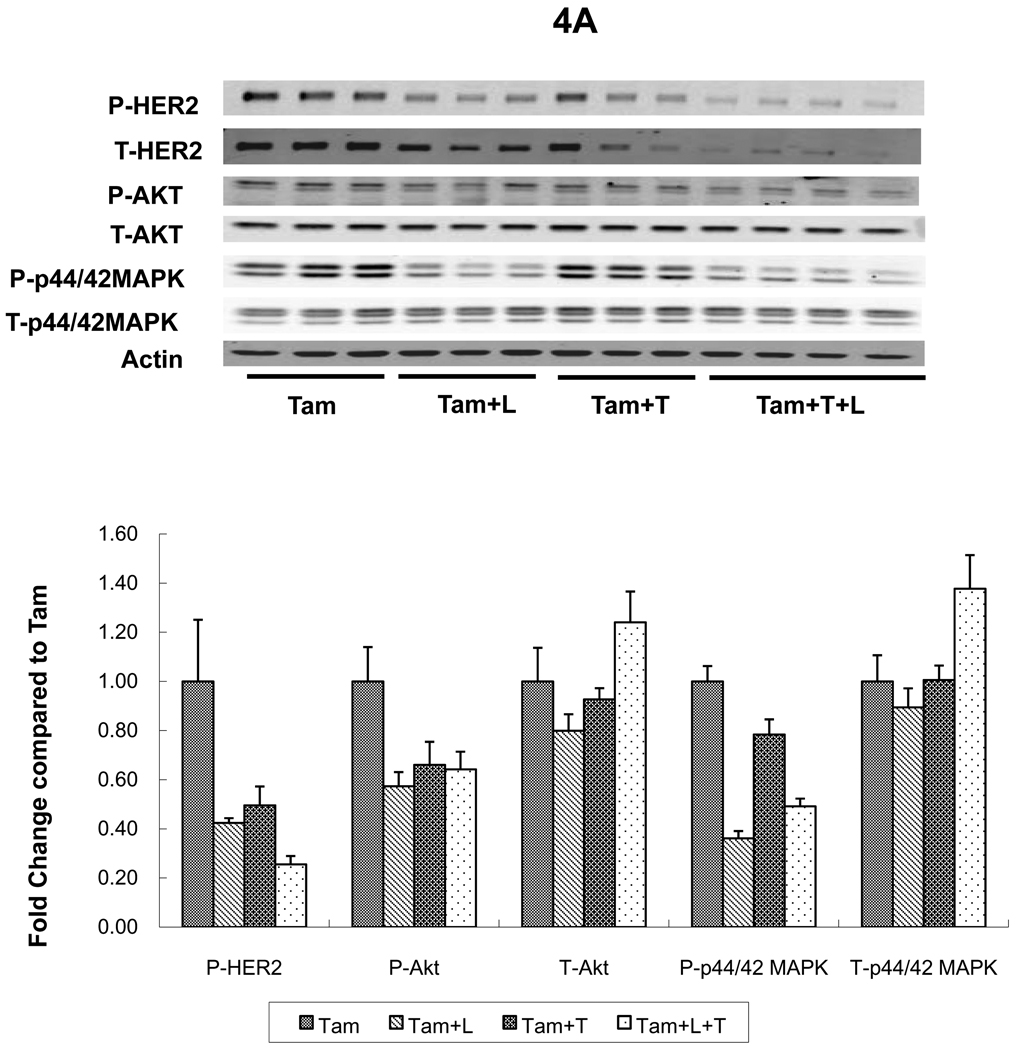
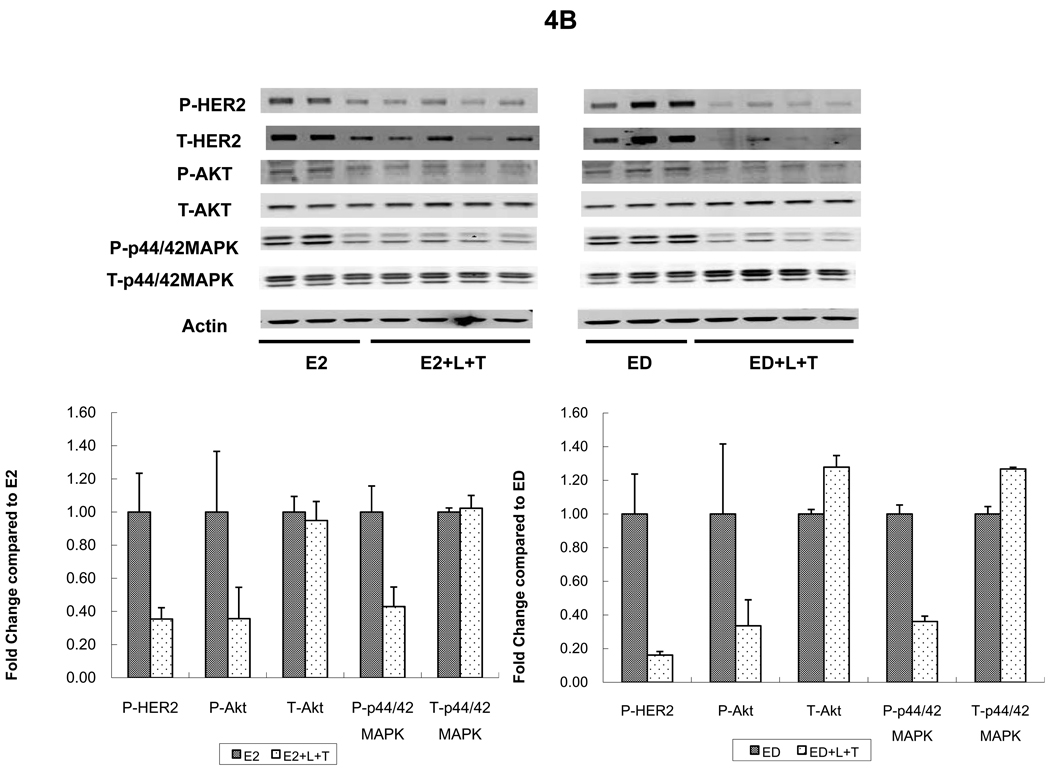
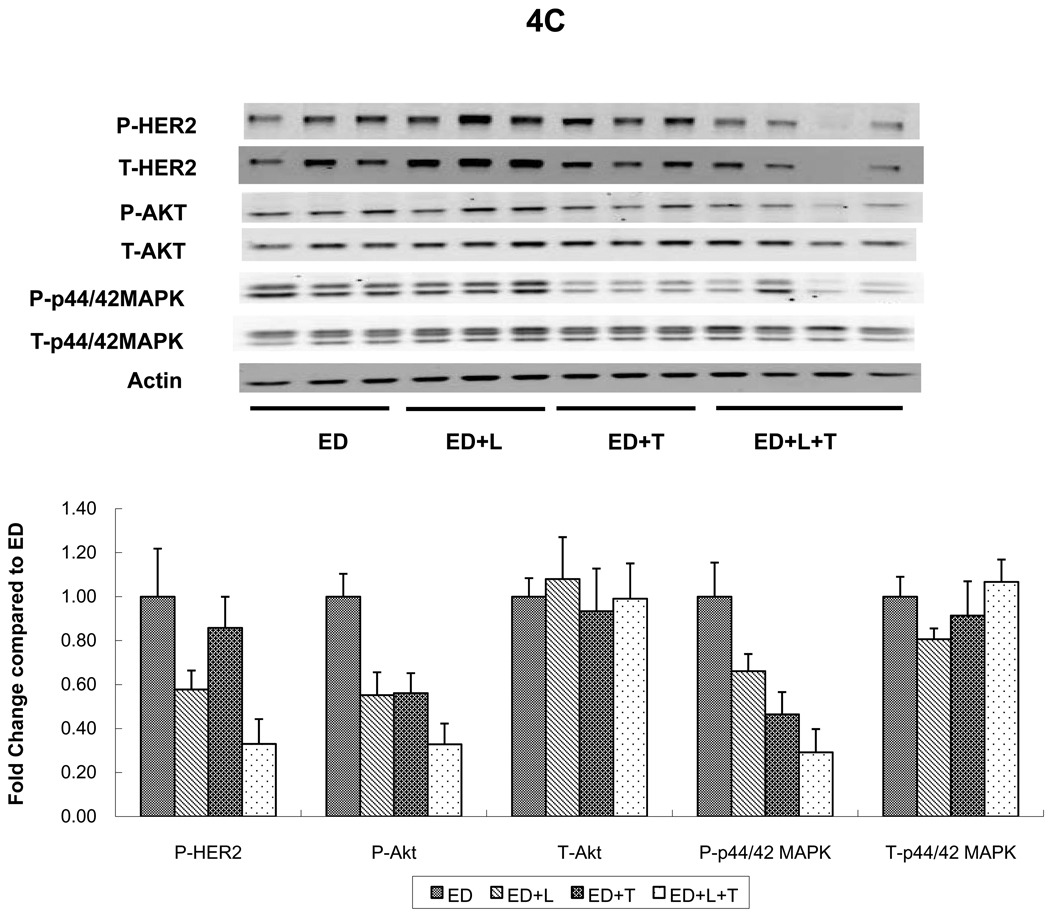
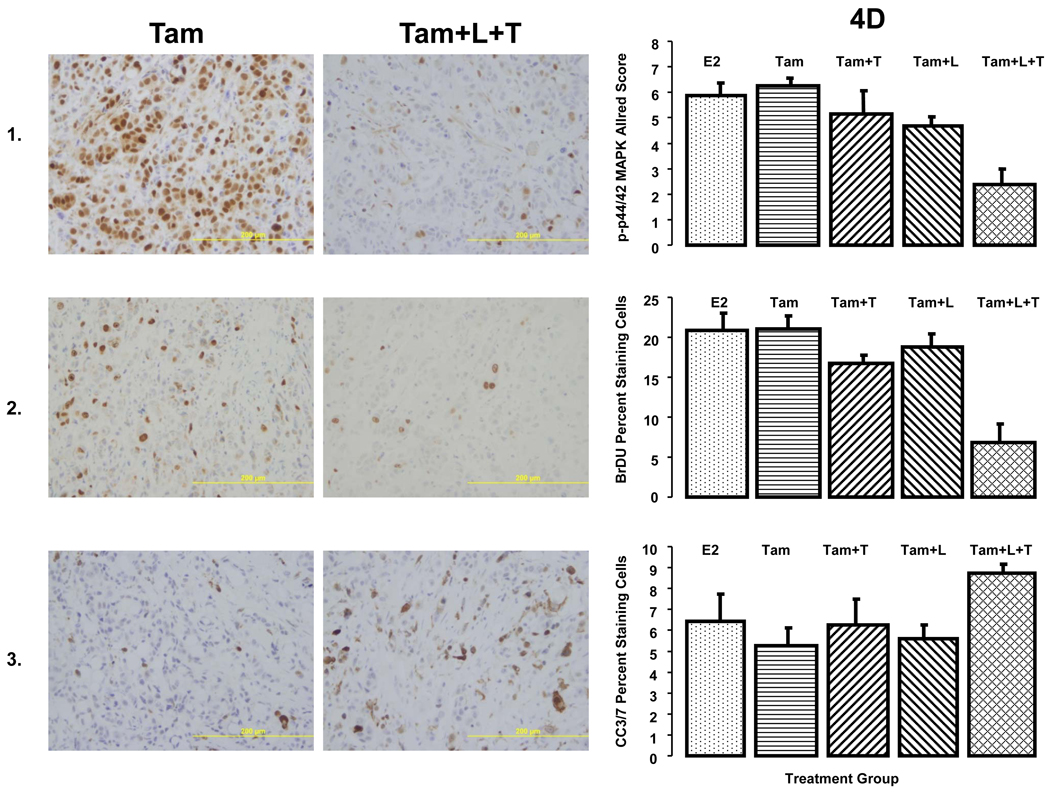
Experimental design: Nude mice bearing HER2-overexpressing MCF7/HER2-18 or BT-474 xenograft tumors were treated with L and T, alone or in various combinations with other HER inhibitors. L + T for short duration (14 and 42 days), intermittent administration (14 days on/off), and reduced dosing (half dose) was also investigated. Inhibition of tumor growth, downstream signaling, proliferation, and induction of apoptosis were assessed. All statistical tests were two-sided.

Results: L + T was the most effective regimen in both MCF7/HER2-18 and BT-474 xenografts with complete regression (CR) of tumor observed in all mice. Intermittent and reduced dose treatment (½ dose) resulted in high rates of CR and low rates of tumor recurrence that were comparable to full dose continuous treatment. L + T resulted in significantly reduced downstream signaling and proliferation, and increased apoptosis.

Conclusions: L + T is a potent and effective combination even when given in reduced dose or intermittent schedule potentially resulting in lower toxicity and reduced cost if translated to patients. These findings warrant timely clinical testing.


Figures

Figure 1
Figure 1
Growth of MCF7/HER2-18 xenograft tumors in athymic female mice treated with variable anti-HER single agents and combinations, with or without ER targeted therapy. A. E2 treatment alone or with lapatinib (E2+L), trastuzumab (E2+T), or their combination (E2+L+T). B. Tamoxifen treatment alone or lapatinib (Tam+L), trastuzumab (Tam+T), or their combination (Tam+L+T). C. Tamoxifen treatment in the presence of estrogen with the combination of lapatinib and (E2+Tam+L+T). D. Estrogen deprivation (ED) alone or along with lapatinib (ED+L), trastuzumab (ED+T), or their combination (ED+L+T). Results are presented as the mean tumor volume; error bars represent the standard error. In panels B, C, D, and E, for each group, the number of mice with complete tumor regression and the total number of mice are shown. E. Tamoxifen treatment with alternative combinations of HER family inhibitors—lapatinib and gefitinib (Tam+L+G), double dose lapatinib 200mg/kg/day (Tam+2L), and tamoxifen with lapatinib and pertuzumab (Tam+L+P). Complete regression was defined as complete tumor regression documented on 3 consecutive weekly measurements.
Figure 1
Figure 1
Growth of MCF7/HER2-18 xenograft tumors in athymic female mice treated with variable anti-HER single agents and combinations, with or without ER targeted therapy. A. E2 treatment alone or with lapatinib (E2+L), trastuzumab (E2+T), or their combination (E2+L+T). B. Tamoxifen treatment alone or lapatinib (Tam+L), trastuzumab (Tam+T), or their combination (Tam+L+T). C. Tamoxifen treatment in the presence of estrogen with the combination of lapatinib and (E2+Tam+L+T). D. Estrogen deprivation (ED) alone or along with lapatinib (ED+L), trastuzumab (ED+T), or their combination (ED+L+T). Results are presented as the mean tumor volume; error bars represent the standard error. In panels B, C, D, and E, for each group, the number of mice with complete tumor regression and the total number of mice are shown. E. Tamoxifen treatment with alternative combinations of HER family inhibitors—lapatinib and gefitinib (Tam+L+G), double dose lapatinib 200mg/kg/day (Tam+2L), and tamoxifen with lapatinib and pertuzumab (Tam+L+P). Complete regression was defined as complete tumor regression documented on 3 consecutive weekly measurements.
Figure 2
Figure 2
Growth of BT474 xenograft tumors in athymic mice treated with estrogen supplementation (E2) or estrogen deprivation (ED) alone or with HER blocking agents. A. Estrogen deprivation (ED) alone or along with lapatinib (ED+L), trastuzumab (ED+T), or their combination (ED+L+T). B. Continued Estrogen supplementation alone or with the combination of lapatinib and trastuzumab (E2+L+T). Results are presented as the mean tumor volume error bars represent the standard error. For each group, the number of mice with complete tumor regression and the total number of mice are shown. Complete regression was defined as complete disappearance of the tumor for 3 consecutive weeks.
Figure 3
Figure 3
Growth of BT474 xenograft tumors in athymic mice treated with estrogen supplementation (E2), or estrogen deprivation (ED) alone and with Lapatinib (L), trastuzumab (T), or their combination (L+T) in various doses and schedules. A. Growth of tumors in animals treated with ED plus short durations of (L+T) for 14 days (ED+L+T 14) and 42 days (ED+L+T 42) compared to control groups treated with E2, ED, ED+L, and ED+T. B. Growth of tumors treated with ED with full continuous (L+T), reduced dose therapy (1/2L+1/2T), or intermittent therapy (ED+L+T 14 on/off). For each group, the number of mice with complete tumor regression and the total number of mice are shown. Complete regression was defined as complete disappearance of the tumor for 3 consecutive weeks.
Figure 4
Figure 4
HER2 and downstream signaling pathways were assessed in tumors from two cell lines grown as xenografts in athymic mice and treated for 3 days. A. MCF7/HER2-18 xenograft tumors treated with tamoxifen (Tam) alone or with lapatinib (Tam+L), trastuzumab (Tam+T), or their combination (Tam+L+T). B. MCF7/HER2-18 xenograft tumors grown with estrogen (E2) alone or with the combination of lapatinib and trastuzumab (E2+L+T) and estrogen deprivation (ED) alone or with the combination of lapatinib and trastuzumab (ED+L+T). C. BT474 xenograft tumors treated with estrogen deprivation (ED) alone or with lapatinib (ED+L), trastuzumab (ED+T), or their combination (ED+L+T). Proteins from tumor lysates were separated by sodium dodecylsulfate-polyacrylamide gel electrophoresis and subjected to immunoblot analysis with antibodies specific to total HER2, total Akt, total MAPK, phosphorylated HER2 (at Tyr1248); phosphorylated Akt (at Thr308) and phosphorylated p44/42 MAPK (at Thr202 and Tyr204); or β-actin. Protein expression and phosphorylation levels were quantified by Odyssey Infrared Imaging System. In each tumor, protein levels were normalized to the level of β-actin (the loading-control; by the formula, protein level/actin level *100). For each treatment arm, protein expression levels were compared with control group (Tam, E2, ED) as 1.00. D. IHC studies on MCF7/HER2-18 xenografts: The pictures on the left are representative images of each biomarker staining. The panels on the left are quantitative representations of biomarker expression. Panel 1. Expression of phosphorylated p44/42 MAPK (at Thr202 and Tyr204) in MCF7/HER2-18 xenograft tumors treated with estrogen (E2), tamoxifen (Tam) alone, or with lapatinib (Tam+L), trastuzumab (Tam+T), and the combination (Tam+L+T). The length of treatment was 3 days. Levels of phosphorylated MAPK were assessed by immunohistochemical staining and reported using the Allred Score. There were at least 8 tumors from each group. Panel 2. Cell proliferation: Bromodeoxyuridine staining was used to measure cell proliferation. Proliferation was measured in tumors, eight from each treatment group, after 3 days of treatment. Results are the percentage of cells positive for bromodeoxyuridine. Panel 3. Apoptosis Levels of cleaved caspase 3/7 were assessed immunohistochemically by use of an antibody against cleaved caspase 3/7 after day 3 of treatment. Apoptosis was measured at least 8 tumors from each treatment group. Results are the percentage of cells positive for cleaved caspase 3/7. In all panels, error bars represent the standard error.
Figure 4
Figure 4
HER2 and downstream signaling pathways were assessed in tumors from two cell lines grown as xenografts in athymic mice and treated for 3 days. A. MCF7/HER2-18 xenograft tumors treated with tamoxifen (Tam) alone or with lapatinib (Tam+L), trastuzumab (Tam+T), or their combination (Tam+L+T). B. MCF7/HER2-18 xenograft tumors grown with estrogen (E2) alone or with the combination of lapatinib and trastuzumab (E2+L+T) and estrogen deprivation (ED) alone or with the combination of lapatinib and trastuzumab (ED+L+T). C. BT474 xenograft tumors treated with estrogen deprivation (ED) alone or with lapatinib (ED+L), trastuzumab (ED+T), or their combination (ED+L+T). Proteins from tumor lysates were separated by sodium dodecylsulfate-polyacrylamide gel electrophoresis and subjected to immunoblot analysis with antibodies specific to total HER2, total Akt, total MAPK, phosphorylated HER2 (at Tyr1248); phosphorylated Akt (at Thr308) and phosphorylated p44/42 MAPK (at Thr202 and Tyr204); or β-actin. Protein expression and phosphorylation levels were quantified by Odyssey Infrared Imaging System. In each tumor, protein levels were normalized to the level of β-actin (the loading-control; by the formula, protein level/actin level *100). For each treatment arm, protein expression levels were compared with control group (Tam, E2, ED) as 1.00. D. IHC studies on MCF7/HER2-18 xenografts: The pictures on the left are representative images of each biomarker staining. The panels on the left are quantitative representations of biomarker expression. Panel 1. Expression of phosphorylated p44/42 MAPK (at Thr202 and Tyr204) in MCF7/HER2-18 xenograft tumors treated with estrogen (E2), tamoxifen (Tam) alone, or with lapatinib (Tam+L), trastuzumab (Tam+T), and the combination (Tam+L+T). The length of treatment was 3 days. Levels of phosphorylated MAPK were assessed by immunohistochemical staining and reported using the Allred Score. There were at least 8 tumors from each group. Panel 2. Cell proliferation: Bromodeoxyuridine staining was used to measure cell proliferation. Proliferation was measured in tumors, eight from each treatment group, after 3 days of treatment. Results are the percentage of cells positive for bromodeoxyuridine. Panel 3. Apoptosis Levels of cleaved caspase 3/7 were assessed immunohistochemically by use of an antibody against cleaved caspase 3/7 after day 3 of treatment. Apoptosis was measured at least 8 tumors from each treatment group. Results are the percentage of cells positive for cleaved caspase 3/7. In all panels, error bars represent the standard error.

References

    1. Yarden Y, Sliwkowski MX. Untangling the ErbB signalling network. Nat Rev Mol Cell Biol. 2001;2:127–137. - PubMed
    1. Citri A, Yarden Y. EGF-ERBB signalling: towards the systems level. Nat Rev Mol Cell Biol. 2006;7:505–516. - PubMed
    1. Maurer CA, Friess H, Kretschmann B, et al. Increased expression of erbB3 in colorectal cancer is associated with concomitant increase in the level of erbB2. Hum Pathol. 1998;29:771–777. - PubMed
    1. Alimandi M, Romano A, Curia MC, et al. Cooperative signaling of ErbB3 and ErbB2 in neoplastic transformation and human mammary carcinomas. Oncogene. 1995;10:1813–1821. - PubMed
    1. Wallasch C, Weiss FU, Niederfellner G, Jallal B, Issing W, Ullrich A. Heregulin-dependent regulation of HER2/neu oncogenic signaling by heterodimerization with HER3. Embo J. 1995;14:4267–4275. - PMC - PubMed

Publication types