. 2010 Dec 7;3(151):ra87.
doi: 10.1126/scisignal.2001173.

A kinase-independent role for unoccupied insulin and IGF-1 receptors in the control of apoptosis

Affiliations

A kinase-independent role for unoccupied insulin and IGF-1 receptors in the control of apoptosis

Jeremie Boucher et al. Sci Signal. .

Abstract

Insulin and insulin-like growth factor 1 (IGF-1) act as antiapoptotic hormones. We found that, unexpectedly, double-knockout (DKO) cells that lacked both insulin and IGF-1 receptors (IR and IGF1R, respectively) were resistant to apoptosis induced through either the intrinsic or the extrinsic pathway. This resistance to apoptosis was associated with decreased abundance of the proapoptotic protein Bax and increases in abundance of the antiapoptotic proteins Bcl-2, Bcl-xL, XIAP, and Flip. These changes in protein abundance involved primarily posttranscriptional mechanisms. Restoration of IR or IGF1R to DKO cells also restored their sensitivity to apoptosis. Notably, expression of a catalytically inactive mutant form of the IR also restored susceptibility to apoptosis. Thus, IR and IGF1R have bidirectional roles in the control of cell survival and can be viewed as dependence receptors. Insulin and IGF-1 binding stimulates receptor tyrosine kinase activity and blocks apoptosis, whereas unliganded IR and IGF1R, acting through a mechanism independent of their catalytic activity, exert a permissive effect on cell death.


Figures
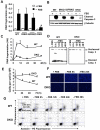
Fig. 1
Fig. 1. Reduced apoptosis in DKO cells compared to WT cells
A) Confluent WT, IRKO, IGFRKO, and DKO cells were serum-deprived for 6 hours and DNA fragmentation performed. Data are mean ± S.E.M from 4 independent experiments. * indicates a significant difference compared to WT cells, p value <0.05 by Student’s t test. AU: arbitrary unit B) Immunoblots to detect caspase 3 cleavage were performed on confluent WT, IRKO, IGFRKO, or DKO cells serum-deprived for 6 hours. One representative blot from 4 independent experiments is shown. C) Confluent WT or DKO cells were serum-deprived for 6 to 48 hours and DNA fragmentation was measured. Data are mean ± S.E.M from 4 independent experiments. D) Confluent WT or DKO cells were serum-deprived for 6 to 48 hours. One representative blot of caspase 3 cleavage from 3 independent experiments is shown. E) WT or DKO cells were grown in 6 well plates to about 90% confluence and then serum-deprived for 3 days. Cell number was determined after 24, 48, and 72 hours of serum deprivation. Data are mean ± S.E.M from 8 independent experiments. F) Confluent WT or DKO cells were serum- deprived for the indicated hours and incubated with Hoechst 33342 (1 μg/ml). G) Confluent WT or DKO cells were serum- deprived for 6 to 48 hours. Cells were incubated with both annexin V PE and propidium iodide (PI) and FACS analysis performed. PI staining of the DNA indicates cell death, whereas PE staining shows binding of annexin V to the phosphatidyl serines of the membrane and thus apoptosis. One representative experiment of 3 is shown.
Fig. 2
Fig. 2. DKO cells are resistant to apoptosis mediated through both the intrinsic and extrinsic pathways
Confluent WT or DKO cells were serum-deprived or exposed to etoposide (25μM), hydrogen peroxide (5μM), paraquat (1mM), FasL (100ng/ml), or TNF α (50 ng/ml) for 24 hours in the presence of serum. A) Floating cells were collected and pooled with attached cells recovered after trypsin treatment and DNA fragmentation was measured. Data are mean ± S.E.M from 4 independent experiments. * indicates a significant difference compared to WT cells, p value <0.05 by Student’s t test. B) Protein extracts were subjected to SDS-PAGE and Western blot analysis for caspase 3. One representative of 4 independent experiments is shown. C) Confluent WT or DKO cells were incubated in medium without serum and treated or not with IGF-1 (100 nM) or insulin (100 nM) for 6 hours. Protein lysates from floating and attached cells were subjected to SDS-PAGE and Western blot analysis for caspase 3. One representative blot from 2 independent experiments is shown. D) Confluent WT or DKO cells were treated with TNFα (50 ng/ml) with or without IGF-1 (100 nM) for 6 hours. Protein lysates from floating and attached cells were subjected to SDS-PAGE and Western blot analysis for caspase 3. One representative blot from 2 independent experiments is shown.
Fig. 3
Fig. 3. Apoptosis resistance in double knock down brown preadipocyte cells and MEFs
A) IR and IGF1R mRNA (graph) and protein (blot) abundance was measured in confluent IRlox/IGFRlox brown preadipocytes 5 to 7 days after infection with a GFP-tagged Cre adenovirus (BAT DKD) or with the GFP control adenovirus (BAT Cont). IR and IGF1R mRNA were measured by real time PCR and were normalized to Tata binding protein (TBP) mRNA. B) Confluent BAT Cont and BAT DKD cells were serum-deprived for 12 hours. Floating and attached cells were incubated with annexin V PE and propidium iodide (PI), and FACS analysis performed. Results represent the percentage of annexin-positive to total cells. Results are mean ± S.E.M from 5 independent experiments. * indicates a significant difference compared to control cells, p value <0.05 by Student’s t test. C) Confluent BAT Cont and BAT DKD cells were serum-deprived for 12 hours. One representative blot of casapse 3 cleavage from 5 independent experiments is shown. D) IR and IGF1R mRNA (graph) and protein (blot) levels were measured in confluent IRlox/IGFRlox MEFs 5 to 7 days after infection with a Cre adenovirus (MEF DKD) or the control adenovirus (MEF Cont). IR and IGF1R mRNA were measured by real-time PCR and normalized to TBP mRNA. B) Confluent MEF Cont and MEF DKD cells were treated with 1mM H2O2 for 24 hours. Floating and attached cells were incubated with annexin V PE and propidium iodide (PI), and FACS analysis performed. Results represent the percentage of annexin-positive to total cells. Results are mean ± S.E.M from 5 independent experiments. * indicates a significant difference compared to control cells, p value <0.05 by Student’s t test.
Fig. 4
Fig. 4. Decreased Bax abundance and increased Bcl-xL and Bcl-2 abundance in DKO cells
A) Proliferating (50% confluent) or confluent WT or DKO cells were maintained in serum for 6 or 24 hours. Confluent cells were also serum-starved for 6 or 24 hours or treated with TNFα (50 ng/ml) for 24 hours. Immunoblots were performed on protein lysates from floating and attached cells. One representative Western blot from 3 independent experiments is shown. Bax (B) and Bcl-xL and Bcl-2 (C) protein and mRNA levels were quantified in WT or DKO confluent cells maintained in the presence or in the absence of serum for 24 hours. Results are normalized to β tubulin levels and are mean ± S.E.M from 5 independent experiments. mRNA levels were quantified by real-time PCR. The data were normalized to TBP mRNA. Results are mean ± S.E.M from 6 independent experiments. * indicates a significant difference compared to WT cells, p value <0.05 by Student’s t test.
Fig. 5
Fig. 5. Increased Flip and XIAP abundance in DKO cells
A) Proliferating (50% confluent) or confluent WT and DKO cells were maintained in the presence of serum for 6 or 24 hours. Confluent cells were also serum-starved for 6 or 24 hours or treated with TNFα (50 ng/ml) for 24 hours. Immunoblots were performed on protein lysates from floating and attached cells. One representative Western blot from 3 independent experiments is shown. B) Flip and XIAP protein and mRNA levels were quantified in WT and DKO confluent cells maintained in the presence or in the absence of serum for 24 hours. Results are normalized to β tubulin abundance and are mean ± S.E.M from 5 independent experiments. mRNA abundance was quantified by real-time PCR. The data were normalized to levels of TBP mRNA. Results are mean ± S.E.M from 6 independent experiments. * indicates a significant difference compared to WT cells, p value <0.05 by Student’s t test.
Fig. 6
Fig. 6. IR, IGF1R, or inactive IR mutant rescues susceptibility to apoptosis in DKO cells
A) Confluent DKO cells expressing hIR, hIGFR, or both were serum-starved for 6 hours and then treated with 100 nM insulin for 5 minutes, after which cells were harvested and immunoblots were performed. One representative Western blot from 3 independent experiments is shown. B) Confluent DKO cells expressing hIR, hIGFR, or both were serum-starved for 6 hours. One representative Western blot from 4 independent experiments is shown. C) Confluent DKO cells expressing wild type human IR, or K1030R human IR were serum-starved for 6 hours and then treated with 100 nM insulin for 5 minutes, after which cells were harvested and immunoblots were performed. One representative Western blot from 3 independent experiments is shown. D) Confluent DKO cells expressing wild type human IR, or K1030R human IR mutant were serum-starved for 6 hours. One representative Western blot from 5 independent experiments is shown.
Fig. 7
Fig. 7. Representation of the three state model for IR and IGF1R signaling in apoptosis
IR and IGFR are receptor tyrosine kinases. Ligand binding ("occupied state") stimulates their intrinsic kinase activity to produce anti-apoptotic signals. In the "unoccupied state", receptors are permissive for apoptosis, which takes place in response to various apoptotic inducers such as serum deprivation, etoposide, hydrogen peroxide, paraquat, FasL or TNF α treatments. In the "no receptor state", simultaneous deletion of the IR and IGF1R leads to marked resistance to apoptosis, associated with changes in abundance of apoptotic proteins.

References

    1. Arends MJ, Wyllie AH. Apoptosis: mechanisms and roles in pathology. Int.Rev.Exp Pathol. 1991;32:223–254. - PubMed
    1. Brill A, Torchinsky A, Carp H, Toder V. The role of apoptosis in normal and abnormal embryonic development. J Assist.Reprod.Genet. 1999;16:512–519. - PMC - PubMed
    1. Thompson CB. Apoptosis in the pathogenesis and treatment of disease. Science. 1995;267:1456–1462. - PubMed
    1. Nicholson DW. ICE/CED3-like proteases as therapeutic targets for the control of inappropriate apoptosis. Nat.Biotechnol. 1996;14:297–301. - PubMed
    1. Chowdhury I, Tharakan B, Bhat GK. Current concepts in apoptosis: the physiological suicide program revisited. Cell Mol Biol Lett. 2006;11:506–525. - PMC - PubMed

Publication types

MeSH terms