Review
. 2010 Nov-Dec;4(6):459-74.
doi: 10.4161/chan.4.6.12867.

Progress in the structural understanding of voltage-gated calcium channel (CaV) function and modulation

Affiliations
Review

Progress in the structural understanding of voltage-gated calcium channel (CaV) function and modulation

Daniel L Minor Jr et al. Channels (Austin). 2010 Nov-Dec.

Abstract

Voltage-gated calcium channels (CaVs) are large, transmembrane multiprotein complexes that couple membrane depolarization to cellular calcium entry. These channels are central to cardiac action potential propagation, neurotransmitter and hormone release, muscle contraction, and calcium-dependent gene transcription. Over the past six years, the advent of high-resolution structural studies of CaV components from different isoforms and CaV modulators has begun to reveal the architecture that underlies the exceptionally rich feedback modulation that controls CaV action. These descriptions of CaV molecular anatomy have provided new, structure-based insights into the mechanisms by which particular channel elements affect voltage-dependent inactivation (VDI), calcium‑dependent inactivation (CDI), and calcium‑dependent facilitation (CDF). The initial successes have been achieved through structural studies of soluble channel domains and modulator proteins and have proven most powerful when paired with biochemical and functional studies that validate ideas inspired by the structures. Here, we review the progress in this growing area and highlight some key open challenges for future efforts.


Figures

Figure 1
Figure 1
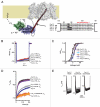
Voltage gated calcium channel structure. (A) Cartoon diagram representing a CaV1 or CaV2 channel. The four homologous transmembrane domains of CaVα1 are indicated. CaVβ is shown in dark blue and interacts with its high-affinity binding site on the I–II intracellular loop known as the “α-interaction domain, AID”. CaM is shown bound to the C-terminal cytoplasmic tail at the site of the IQ domain. The membrane associated CaVα2δ subunit is shown in orange and green. (B) Topology of the pore-forming CaVα1 subunit. Positions of the CaVβ/AID complex, Ca2+/CaM-PreIQ complex and Ca2+/CaM-IQ domain complex are shown. CaVα1 intracellular loops are drawn to scale according to the human CaV1.2 sequence.
Figure 2
Figure 2
CaVβ-AID interactions. (A) Structure of the CaVβ-AID complex from reference . SH3 and NK domains are shown in green and blue, respectively. The AID is shown in red with the sidechains depicted as sticks. Variable domains V1, V2 and V3 are indicated. (B) Energetics of the CaVβ-AID interaction. Residues are colored according to their impact on CaVβ-AID binding as follows: <0.5 kcal mol−1, dark blue; 0.5–1.5 kcal mol−1, light blue; 1.5–3.0 kcal mol−1, orange; >3 kcal mol−1, red. Select AID (L434, L438 Y437, W440 and I441) and CaVβ (M245 and L352) residues are labeled. (C) View of the complementary CaVβ-AID hotspots from the perspective of CaVβ. Colors and labels are as in (B). (D) Disruption of the AID-CaVβ hotspot interaction by the AID mutant (HotA) abolishes CaVβ-dependent modulation. Data in (B–D) are from Van Petegem et al.
Figure 3
Figure 3
CaVβ controls channel function via the IS6-AID helix. (A) Model showing the proposed continuous helix between the IS6 transmembrane segment and the AID. Model is based on the likely gross similarly between the transmembrane portions of CaV and KV channels. A surface representation (white) of the KV tranmembrane portion (PDB 2A79) is used to depict the CaV transmembrane domains. The helical IS6-AID segment (red) was modeled manually by building an α-helix corresponding to the length between the KV1.2 S6 C-terminus and the helix from the CaVβ2a-AID complex (PDB 1T0J). The CaVβ2a SH3 and NK domains are colored green and blue, respectively. Arrow indicates the site of the depicted polyglycine and polyalanine substitutions studied in Findeisen et al. Effects of IS6-AID substitutions on (B) CaV1.2 VDI. C, CaV1.2 voltage-dependent activation. (D) CaV1.2 netCDI and (F) CaV1.2 CDF. Experimental details can be found in Findeisen et al. (B–E) Reprinted from Findeisen et al.
Figure 4
Figure 4
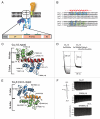
Ca2+/CaM-CaV IQ domain interactions. (A) CaV cartoon showing the relative locations of the EF-hand, PreIQ, A-region, C-region and IQ domains in CaV1 and CaV2 C-terminal tails. (B) Sequence comparison of CaV1 and CaV2 IQ domains. Colors indicate residues having contacts with Ca2+/N-lobe, Ca2+/C-lobe, or both domains in the parallel (CaV1) and antiparallel (CaV2) complexes. (C) Structure of the Ca2+/CaM-CaV1.2 IQ peptide complex (PDB: 2BE6). Ca2+/N-lobe and Ca2+/C-lobe are shown in green and blue, respectively. CaV1.2 IQ domain is shown in firebrick and selected residues are shown in stick representation. The “IQ” positions are labeled. (D) Elimination of Ca2+/N-lobe aromatic anchors abolishes CaV1.2 CDF. Experiments show the response of CaV1.2 to a 3-Hz pulse train (50 ms steps to +20 mV from a holding potential of −90 mV) and are done in the background of the I1624A mutant that unmasks CDF. Reprinted from Van Petegem F, et al. (E) Structure of the Ca2+/CaM-CaV2.3 IQ peptide complex (PDB: 3DVK). Ca2+/CaM lobes and calcium ions are colored as in (C). CaV2.3 IQ domain is shown in orange and the aromatic anchor positions are white and shown in stick representation. (F) Elimination of Ca2+/C-lobe anchors demonstrates importance for CaV2.1 CDF. Ca2+ currents in wild-type (WT) and mutant CaV2.1 channels elicited by trains of an action potential waveform (APW) at 100 Hz. A single exemplar depolarizing APW pulse and elicited Ca2+ current is shown (left). Reprinted from Kim et al.
Figure 5
Figure 5
(A) Lobe-specific roles in CaV1.2 and CaV2.1 CDI and CDF. (B) Diagrams of the orientations of Ca2+/CaM on the CaV1 and CaV2 IQ domains and the roles of the individual lobes based on references and .
Figure 6
Figure 6
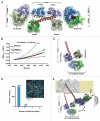
Structure and characterization of the Ca2+/CaM-PreIQ-IQ domain complex. (A) Two CaV1.2 PreIQ helices (red and wheat) form a crystallographic dimer cross-bridged by Ca2+/CaMs. Ca2+/CaM N-lobe and C-lobe are colored green and blue, respectively. N- and C-termini of PreIQ-IQ domain are indicated. (B) Sedimentation equilibrium analysis of 100 µM Ca2+/CaM-CaV1.2 PreIQ-IQ complex at 11,000 rpm and 4°C and measured at 293 nm. Raw data (black open circles) and single species fit (black line) are compared to predicted curves for complexes having Ca2+/CaM:CaV1.2 tail ratios of 1:1 (red), 2:1 (yellow), 2:2 (green) and 4:2 (blue). Inset shows the distribution of residuals as a function of radial distance. Reprinted from Kim et al. (C) Cartoon diagram of the 2:1 Ca2+/CaM-CaV1.2 PreIQ-IQ complex. C-lobeC indicates the Ca2+/CaM lobe bound to the C-region site. (D) TIRF image of CaV1.2-GFP in a live cell membrane of a X. laevis oocyte. Blue circles mark the selected spots used for subunit counting. Inset shows distribution of fluorescent spots that bleach in one or more steps. Each bleaching step indicates one CaVα1 subunit. Reprinted from Kim EY et al. (E) Model depicting the possible relative positions of CaV intracellular elements based on Figure 3A. “??” signifies the potential for a Ca2+/CaM anchored at the C-region site to make bridging interactions with other components of the CaV complex. Relative orientation of the C-terminal tail is chosen to display the key elements. Its orientation relative to the other intracellular components is not known. The N-terminal cytoplasmic domain, II–III loop and III–IV loop are not depicted.
Figure 7
Figure 7
CaBP1 structure and function. (A) Sequence comparison of CaBP1 and CaM. Locations of EF-hands and canonical Ca2+-binding positions (x, y, z, −y, −x and −z), N-terminal domain (NT), linker (L) and N- and C-terminal lobes (green and blue, respectively) are shown. Cartoons indicate the loss of at least one Ca2+ binding site in CaBP1 due to substitutions in the canonical EF-hand positions. CaBP1 E94 is colored purple. (B) Comparison of the functional effects on CDI of CaM, CaBP1 and the CaBP1 E94A mutant. Data show normalized calcium currents of CaV1.2 expressed in Xenopus oocytes. Reprinted from Findeisen et al. (C) Cartoon representation of the CaBP1 structure. N-lobe (green), linker (red) and C-lobe (blue) and E94, which is shown in stick representation, are indicated. Calcium ions are depicted as white spheres.
Figure 8
Figure 8
RGK functional effects and Gem G-domain structure. (A) Suppression of CaV1.2 function by co-expression of Kir/Gem. Redrawn from Figure 2 from Beguin et al. (B) Cartoon depiction of the Gem G-domain structure. Switch regions and residues implicated in CaVβ interaction, are indicated. Bound GDP (cyan and orange) and Mg2+ (yellow sphere) are also shown.

References

    1. Hille B. Ion Channels of Excitable Membranes. Sunderland, MA: Sinauer Associates, Inc; 2001.
    1. Catterall WA. Structure and regulation of voltage-gated Ca2+ channels. Annu Rev Cell Dev Biol. 2000;16:521–555. - PubMed
    1. Catterall WA, Perez-Reyes E, Snutch TP, Striessnig J. International Union of Pharmacology. XLVIII. Nomenclature and structure-function relationships of voltage-gated calcium channels. Pharmacol Rev. 2005;57:411–425. - PubMed
    1. Clapham DE. Calcium signaling. Cell. 2007;131:1047–1058. - PubMed
    1. Ashcroft FM. From molecule to malady. Nature. 2006;440:440–447. - PubMed

Publication types

LinkOut - more resources