Comparative Study
. 2011 Jun;166(2):421-31.
doi: 10.1007/s00442-010-1861-4. Epub 2010 Dec 8.

Tri-trophic effects of inter- and intra-population variation in defence chemistry of wild cabbage (Brassica oleracea)

Affiliations
Comparative Study

Tri-trophic effects of inter- and intra-population variation in defence chemistry of wild cabbage (Brassica oleracea)

Jeffrey A Harvey et al. Oecologia. 2011 Jun.

Abstract

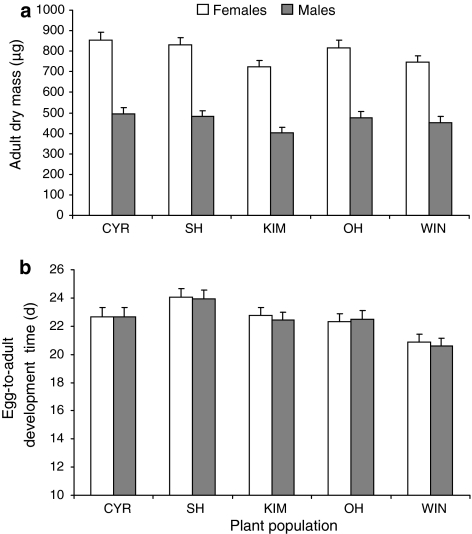
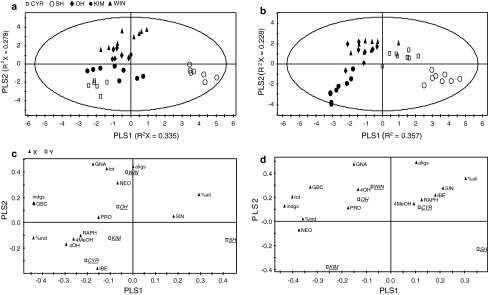
The effect of direct chemical defences in plants on the performance of insect herbivores and their natural enemies has received increasing attention over the past 10 years. However, much less is known about the scale at which this variation is generated and maintained, both within and across populations of the same plant species. This study compares growth and development of the large cabbage butterfly, Pieris brassicae, and its gregarious pupal parasitoid, Pteromalus puparum, on three wild populations [Kimmeridge (KIM), Old Harry (OH) and Winspit (WIN)] and two cultivars [Stonehead (ST), and Cyrus (CYR)] of cabbage, Brassica oleracea. The wild populations originate from the coast of Dorset, UK, but grow in close proximity with one another. Insect performance and chemical profiles were made from every plant used in the experiment. Foliar glucosinolates (GS) concentrations were highest in the wild plants in rank order WIN > OH > KIM, with lower levels found in the cultivars. Caterpillar-damaged leaves in the wild cabbages also had higher GS levels than undamaged leaves. Pupal mass in P. brassicae varied significantly among populations of B. oleracea. Moreover, development time in the host and parasitoid were correlated, even though these stages are temporally separated. Parasitoid adult dry mass closely approximated the development of its host. Multivariate statistics revealed a correlation between pupal mass and development time of P. brassicae and foliar GS chemistry, of which levels of neoglucobrassicin appeared to be the most important. Our results show that there is considerable variation in quantitative aspects of defensive chemistry in wild cabbage plants that is maintained at very small spatial scales in nature. Moreover, the performance of the herbivore and its parasitoid were both affected by differences in plant quality.


Figures

Fig. 1
Fig. 1
a Pupal fresh mass and b egg-to-pupa development time of P. brassicae that were reared in a greenhouse on eight plants of either one of two cabbage cultivars (CYR or SH) or one of three wild cabbage populations (KIM, OH, WIN) from the UK (Dorset). Values are means + SE (n = 8) based on averaged values calculated per plant (initially seven caterpillars were placed on each plant); bars with the same letter are not significantly different (Tukey–Kramer tests for multiple comparisons among means with α = 0.05)
Fig. 2
Fig. 2
a Adult dry mass and b egg-to-adult development time of Pt. puparum that had developed in P. brassicae pupae reared on either one of two cabbage cultivars (CYR or SH) or one of three wild cabbage populations (KIM, OH, WIN) from the UK (Dorset). Values are predicted means + SE for females (white bars) and males (grey bars) and a mean brood size of 39 based on the REML statistical model. For statistical analysis, refer to the text
Fig. 3
Fig. 3
GS concentrations in leaf tissues of undamaged control (left bars in each graph) and P. brassicae-damaged (right bars in each graph) plant individuals sampled from two cabbage cultivars, a CYR and b SH and three wild cabbage populations originating from the UK (Dorset), c KIM, d WIN and e OH, respectively. Plants are ordered from low to high total GS concentrations. Samples from control and damaged plant tissues were taken from different plant individuals. The order of the compounds in the bars is the same as the order of the compounds in the legend. The GS compounds (abbreviation and scientific name) were classified as indole GS: glucobrassicin (GBC 3-indolylmethyl GS), neoglucobrassicin (NEO 1-methoxy-3-indolylmethyl GS), 4-hyddroxy glucobrassicin (4OH 4-hydroxy-3-indolylmethyl GS), 4-methoxy glucobrassicin (4MeOH 4-methoxy-3-indolylmethyl GS) and as aliphatic GS: glucoiberin (IBE 3-methylsulfinylpropyl GS), sinigrin (SIN 2-propenyl GS), glucoraphinin (RAPH 4-methylsulfiniyl-3-butenyl GS), gluconapin (GNA 3-butenyl GS), progoitrin [PRO 2(R)-2-hydroxy-3-butenyl GS]
Fig. 4
Fig. 4
PLS-DA (Projection to Latent Structures Discriminant Analysis) of 14 GS related variables measured in undamaged (a, c) and P. brassicae-damaged (b, d) leaf tissues sampled from two cabbage cultivars (CYR and SH , open symbols) and three wild cabbage populations (KIM, OH, WIN, closed symbols) originating from the UK (Dorset). The score plots (a, b) visualise the structure of the samples according to the first two PLS components with the explained variance in parentheses. The ellipse in the score plots defines the Hotelling’s T2 confidence region, which is a multivariate generalisation of Student’s t test and provides a 95% confidence interval for the observations. The loading plots (c, d) define the orientation of the PLS planes with the original variables in the X (GS variables) and Y space (‘class’ variables), respectively. They reveal the magnitude and direction of correlation of the original variables with the first two PLS components. For an explanation of the GS abbreviations, see Fig. 3. Total GS, total indole GS (ind gs) total aliphatic GS (ali gs) and their percentages of the total amount (%ind and %ali, respectively) were also included as variables. Model statistics for undamaged leaves with three significant components: R 2 X = 0.73, R 2 Y = 0.64, Q 2 = 0.61, and damaged leaves with four significant componenets, R 2 X = 0.85, R 2 Y = 0.82, Q 2 = 0.76)

Similar articles

Cited by

References

    1. Agrawal AA. Induced plant defense: evolution of induction and adaptive phenotypic plasticity. In: Agrawal AA, Tuzun S, Bent E, editors. Induced plant defenses against pathogens and herbivores: biochemistry, ecology and agriculture. Minosota: APS; 1999. pp. 251–268.
    1. Agrawal AA, Kurashige NS. A role for isothiocyanates in plant resistance against the specialist herbivore Pieris rapae. J Chem Ecol. 2003;29:1403–1415. doi: 10.1023/A:1024265420375. - DOI - PubMed
    1. Askew RR, Shaw MR. Parasitoid communities: their size, structure, and development. In: Waage J, Greathead D, editors. Insect parasitoids. London: Academic; 1986. pp. 225–264.
    1. Barbosa P, Saunders JA, Kemper J, Trumbule R, Olechno J, Martinat P. Plant allelochemicals and insect parasitoids: effects of nicotine on Cotesia congregata (Say) (Hymenoptera, Braconidae) and Hyposoter annulipes (Cresson) (Hymenoptera, Ichneumonidae) J Chem Ecol. 1986;12:1319–1328. doi: 10.1007/BF01012351. - DOI - PubMed
    1. Barbosa P, Gross P, Kemper J. Influence of plant allelochemicals on the tobacco hornworm and its parasitoid, Cotesia congregata. Ecology. 1991;72:1567–1575. doi: 10.2307/1940956. - DOI

Publication types

LinkOut - more resources