

doi: 10.1021/cr1001035.
Update 1 of: Tunneling and dynamics in enzymatic hydride transfer
Affiliations
- PMID: 21141912
- PMCID: PMC4067601
- DOI: 10.1021/cr1001035
Item in Clipboard
Update 1 of: Tunneling and dynamics in enzymatic hydride transfer
Chem Rev.
.
No abstract available
Figures

In the classical Marcus theory, the reactant and product potential surfaces are
indicated by R and P, respectively, and their crossing point,
ΔG‡, represents the transition
state with a free energy of activation defined in terms of
λ and ΔG° (eq 1 in text).

Comparison of the configuration of NAD+ based on X-ray
structures of abortive complexes for mutants of HLADH with bound cofactor and
trifluoroethanol. This structure reflects protein with two mutations, F93W and
V203A, where F93W is the reference structure. Upon expansion of the active site
behind the nicotinamide ring, this tilts away from the active site. Reproduced
with permission from ref . Copyright
1997 National Academy of Sciences, U.S.A.

Relationship between the log of the bimolecular rate constant and the exponent
(EXP in eq 6 in the text): (A)
V203G; (B) V203A:F93W; (C) V203A; (D) V203L; (E) F93W; (F) L57F. Reproduced with
permission from ref . Copyright 1997
National Academy of Sciences, U.S.A.

Time courses for hydrogen/deuterium exchange into ht-ADH, which has been digested
into 21 peptides. The five peptides of ht-ADH that show a transition in the same
temperature range (20–40 °C) as that for the transition in
tunneling behavior (30 °C) are shown: 10 °C (closed circles); 20
°C (open circles); 40 °C (closed triangles); 55 °C (open
triangles); 65 °C (closed squares). In part f is shown the temperature
dependence of the weighted average rate constant for H/D exchange at each
temperature for peptides 1–4 and 7. Reproduced with permission from ref
. Copyright 2004 National Academy
of Sciences, U.S.A.

(A) Structural representation of the peptides showing a temperature-dependent
transition in H/D exchange behavior between 20 and 40 °C (cf. Figure 4): peptide 1, red; peptide 2, orange;
peptide 3, purple; peptide 4, purple; peptide 7, red. (B) Those peptides showing
a transition in H/D exchange between 40 and 55 °C (orange, red, and
purple). Reproduced with permission from ref . Copyright 2004 National Academy of Sciences, U.S.A.

One-dimensional barrier penetration model invoked in the context of a tunneling
correction. The lighter isotopes tunnel lower down in the barrier, generating
elevated isotope effects, differences in enthalpies of activation that exceed
the semiclassical limit, and values for
AH/AD ≪
1.
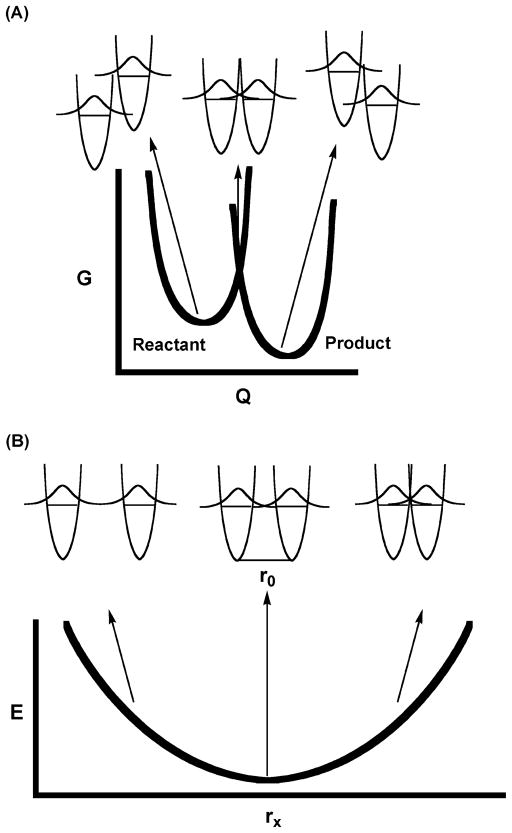
An expanded Marcus model applied to hydrogen transfer. The nuclear coordinates
are represented by Q, the donor–acceptor (gating)
coordinate is represented by rx, and
ro is the initial equilibrium distance. Panel A
is analogous to classical Marcus theory in that heavy nuclear reorganization
(the free energy for this process is represented by the heavy lines as a
function of progress along the coordinate Q) is required before
significant tunneling can take place. The main difference is that hydrogen (and
not electron) wave function overlap determines the tunneling probability. At the
transition state, corresponding to the intersection of the heavy lines, the
hydrogenic potential surfaces are isoenergetic with respect to hydrogen
transfer, so that transitions (tunneling) can take place between them in accord
with the Franck–Condon principle. Panel B illustrates how, once this
configuration is reached, hydrogen wave function overlap can be enhanced by
bringing the donor and acceptor closer together. The ability of thermal
fluctuations to compress the oscillator by an amount Δr
below its equilibrium configuration ro will depend
on the force constant describing the curvature in the potential well. The
distance rx is where the balance between interatomic
repulsive forces and efficient wave function overlap is optimal. It is
anticipated that, for many enzyme active sites, the well will be relatively
stiff, so that the donor–acceptor distance remains near
ro, and gating effects are minimized. Reproduced
with permission from ref . Copyright
2005 Elsevier.

Two scenarios for enzyme active sites can be envisaged. According to (A) the
protein dynamics and active site environment promote close approach between the
H-donor and acceptor, leading to
AH/AD > 1 and EXP
> 3.26. For a “compromised” active site, a greater initial
distance between the donor and acceptor atoms generates
AH/AD < 1 and EXP
≈ 3.26.

Distinction between the types of motion expected to be critical to enzymatic
H-transfer. On the left (A) is the “preorganization” term that
involves a rapid sampling (ns–ms) of multiple conformations, preventing
the active site from becoming trapped in a local minimum with a less optimal
arrangement of bound substrates. On the right (B) is the subsequent
“reorganization” of bound substrates. This is expected to
involve even more rapid sampling (fs–ns) of states that differ with
regard to the relative energy levels of reactant and product and the distances
between reactants. The temperature dependence of the isotope effect comes
primarily from the distance-sampling component of the reorganization term. When
distance sampling has been minimized, as a result of effective preorganization
events, the isotope effect can appear temperature-independent.

Native enzymes are able to transiently sample conformers in which a short
equilibrium donor–acceptor distance r0
supports tunneling of both hydrogen and deuterium with little or no further
distance sampling.

Kinetic mechanism of DHFR at 25 °C, where rate constants pertain to the
protonated enzyme. The kinetic species represented by the abbreviations are as
follows: N, NADP+; NH, NADPH; H2F, dihydrofolate
(referred to as DHF in the text); H4F, tetrahydrofolate (referred to
as THF in the text). Reproduced with permission from ref . Copyright 2006 Annual Reviews.

X-ray structure of E. coli dihydrofolate reductase modeled to be
complexed with NADPH and DHF(H2F). (A) indicates mobile loops in
gray, and (B) shows the location of conserved residues (red) and specifically
G121 and M42 (red spheres). The black sphere indicates the position of hydride
in the active site. Reproduced with permission from ref . Copyright 2002 American Chemical Society.
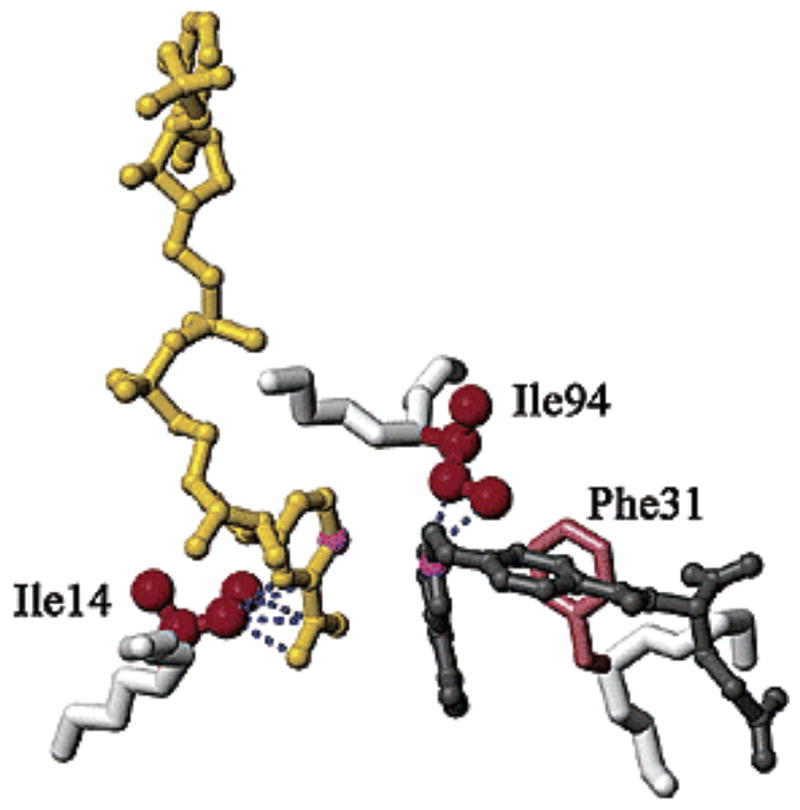
Hydrophobic residues at the active site of ec-DHFR that are proposed to control
the relative position of NAD+ and substrate. Side chains of
residues 14 and 94 are shown in red spheres, NAD in yellow, and folate in black.
Reproduced with permission from ref .
Copyright 2004 American Chemical Society.

Comparison of X-ray structures of homologous DHFRs. (A) Cα overlay for
bs-DHFR (blue) and tm-DHFR (red) and (B) overlay for bs-DHFR (blue) and ec-DHFR
(green). Reproduced with permission from ref . Copyright 2005 American Chemical Society.

Driving force dependence of the observed rate
kcat/KM(O2)
[left ordinate and red squares] and the kinetic isotope
effect
(kcat/KM(O2))
[right ordinate and blue circles].
Republished from
-
Tunneling and dynamics in enzymatic hydride transfer.Chem Rev. 2006 Aug;106(8):3095-118. doi: 10.1021/cr050301x. Chem Rev. 2006. PMID: 16895320 Review. No abstract available.
References
Grants and funding
LinkOut - more resources
Full Text Sources
