

The critical role of S-lactoylglutathione formation during methylglyoxal detoxification in Escherichia coli
- PMID: 21143325
- PMCID: PMC3412212
- DOI: 10.1111/j.1365-2958.2010.07426.x
The critical role of S-lactoylglutathione formation during methylglyoxal detoxification in Escherichia coli
Abstract
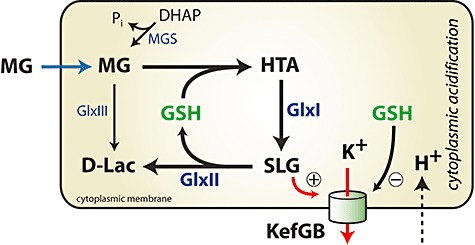
Survival of exposure to methylglyoxal (MG) in Gram-negative pathogens is largely dependent upon the operation of the glutathione-dependent glyoxalase system, consisting of two enzymes, GlxI (gloA) and GlxII (gloB). In addition, the activation of the KefGB potassium efflux system is maintained closed by glutathione (GSH) and is activated by S-lactoylGSH (SLG), the intermediate formed by GlxI and destroyed by GlxII. Escherichia coli mutants lacking GlxI are known to be extremely sensitive to MG. In this study we demonstrate that a ΔgloB mutant is as tolerant of MG as the parent, despite having the same degree of inhibition of MG detoxification as a ΔgloA strain. Increased expression of GlxII from a multicopy plasmid sensitizes E. coli to MG. Measurement of SLG pools, KefGB activity and cytoplasmic pH shows these parameters to be linked and to be very sensitive to changes in the activity of GlxI and GlxII. The SLG pool determines the activity of KefGB and the degree of acidification of the cytoplasm, which is a major determinant of the sensitivity to electrophiles. The data are discussed in terms of how cell fate is determined by the relative abundance of the enzymes and KefGB.
© 2010 Blackwell Publishing Ltd.
Figures
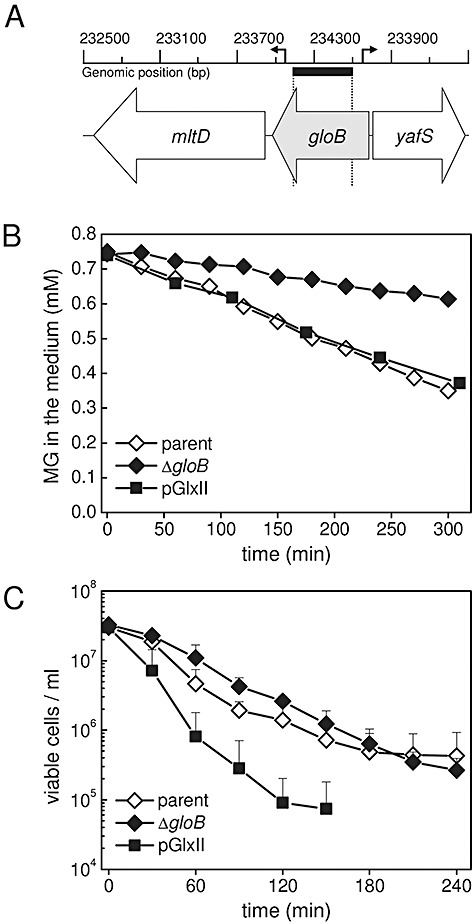
 ) were grown to OD650 of ∼0.4 in K0.2 minimal media and diluted 10-fold into fresh media containing 0.7 mM MG. At intervals the medium was assayed for the disappearance of MG. The data are representative of three independent replicates. C. The gloB null mutant exhibits similar death kinetics to the parent strain upon MG stress. Cells overexpressing GlxII are more sensitive to MG. Cells from the parent (MJF274, ◊), ΔgloB (MJF595, ◆) and pGlxII (
 ) were grown exactly as in B and diluted into media containing 0.7 mM MG. Cell samples were taken at intervals and the number of viable cells determined. Data represent the mean of three independent replicates (standard deviations are shown).
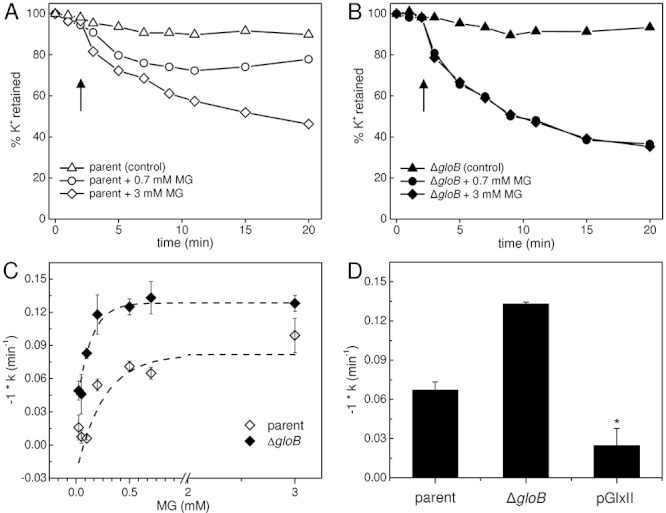
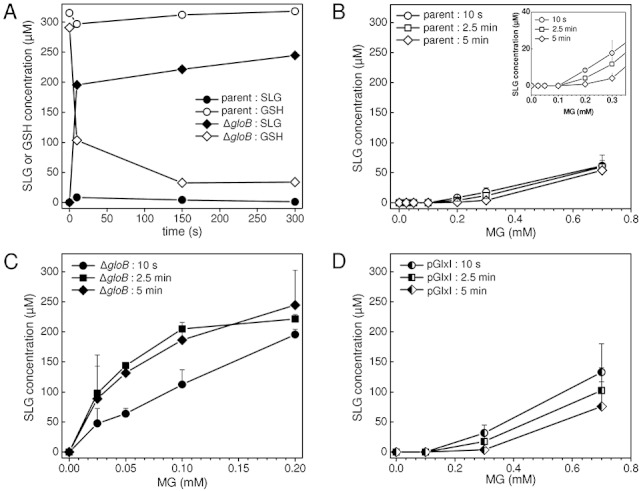
 ) and 5 min (◊, ◆) after addition of MG, and the metabolite pools quantified by LC-MS/MS. The mean and standard deviation of three independent replicate experiments is shown.
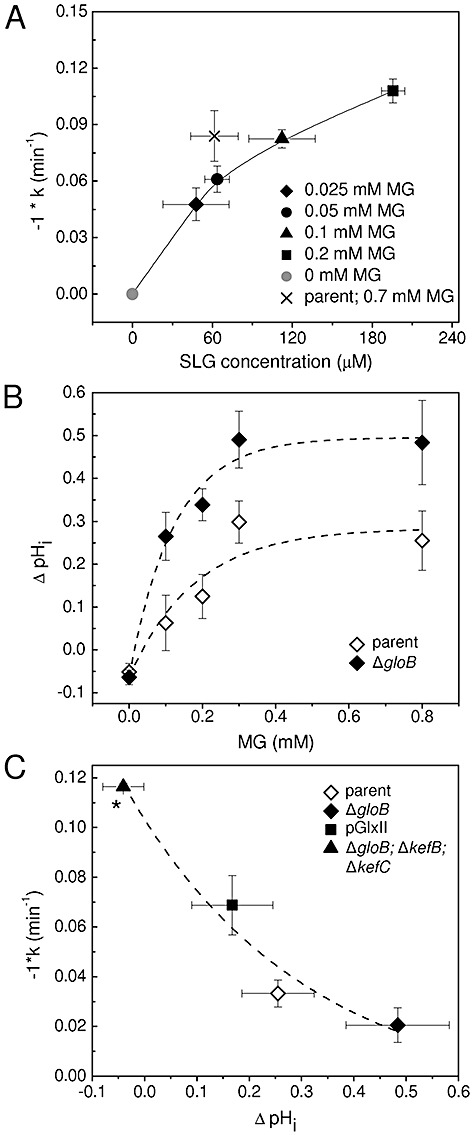
 ) and ΔgloB; ΔkefC; ΔkefB (MJF596, ▴) upon MG exposure were derived from viable cell counts over the first 60 min after addition of 0.7 mM MG. These data were plotted against the ΔpHi calculated as described in B. Data plotted are means ± s.e.m. Data points were fitted using an exponential association function in the Origin 8.0 software [Equation: y = A1 × exp(−x/t1) + y0]. The output is shown as a dashed line and the adjusted R2 = 0.89. *As a consequence of the method used to determine pHi and subsequently derive ΔpHi, the absence of a drop in pHi upon addition of MG, as is the case for MJF596, can lead to a negative value for ΔpHi as the steady state pHi measured over the time-course fluctuates around pH 7.8.
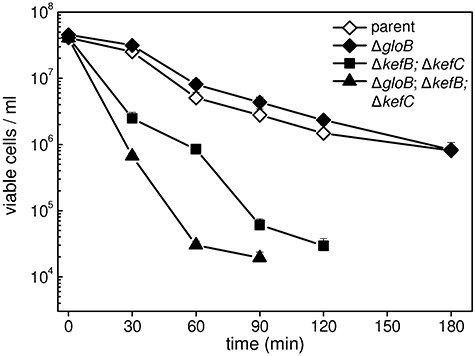
 ) and MJF596 (ΔgloB, kefB, kefC::Tn10; ▴) were grown in K0.2 minimal media, exposed to 0.7 mM MG and viable cells enumerated exactly as for experiments presented in Fig. 2. The mean and standard deviation of three independent experiments is shown.
Similar articles
-
Deciphering the role of the type II glyoxalase isoenzyme YcbL (GlxII-2) in Escherichia coli.FEMS Microbiol Lett. 2015 Jan;362(2):1-7. doi: 10.1093/femsle/fnu014. Epub 2014 Dec 4. FEMS Microbiol Lett. 2015. PMID: 25670698
-
The role of glyoxalase I in the detoxification of methylglyoxal and in the activation of the KefB K+ efflux system in Escherichia coli.Mol Microbiol. 1998 Feb;27(3):563-71. doi: 10.1046/j.1365-2958.1998.00701.x. Mol Microbiol. 1998. PMID: 9489668
-
Importance of glutathione for growth and survival of Escherichia coli cells: detoxification of methylglyoxal and maintenance of intracellular K+.J Bacteriol. 1998 Aug;180(16):4314-8. doi: 10.1128/JB.180.16.4314-4318.1998. J Bacteriol. 1998. PMID: 9696786 Free PMC article.
-
Methylglyoxal production in bacteria: suicide or survival?Arch Microbiol. 1998 Oct;170(4):209-18. doi: 10.1007/s002030050635. Arch Microbiol. 1998. PMID: 9732434 Review.
-
Microbial glyoxalase enzymes: metalloenzymes controlling cellular levels of methylglyoxal.Drug Metabol Drug Interact. 2008;23(1-2):29-50. doi: 10.1515/dmdi.2008.23.1-2.29. Drug Metabol Drug Interact. 2008. PMID: 18533363 Review.
Cited by
-
Dissecting a complex chemical stress: chemogenomic profiling of plant hydrolysates.Mol Syst Biol. 2013 Jun 18;9:674. doi: 10.1038/msb.2013.30. Mol Syst Biol. 2013. PMID: 23774757 Free PMC article.
-
Metabolic Shades of S-D-Lactoylglutathione.Antioxidants (Basel). 2022 May 20;11(5):1005. doi: 10.3390/antiox11051005. Antioxidants (Basel). 2022. PMID: 35624868 Free PMC article. Review.
-
Methylglyoxal resistance in Bacillus subtilis: contributions of bacillithiol-dependent and independent pathways.Mol Microbiol. 2014 Feb;91(4):706-15. doi: 10.1111/mmi.12489. Epub 2014 Jan 7. Mol Microbiol. 2014. PMID: 24330391 Free PMC article.
-
Context-dependent change in the fitness effect of (in)organic phosphate antiporter glpT during Salmonella Typhimurium infection.Nat Commun. 2025 Feb 24;16(1):1912. doi: 10.1038/s41467-025-56851-5. Nat Commun. 2025. PMID: 39994176 Free PMC article.
-
Pathoadaptive Mutations of Escherichia coli K1 in Experimental Neonatal Systemic Infection.PLoS One. 2016 Nov 18;11(11):e0166793. doi: 10.1371/journal.pone.0166793. eCollection 2016. PLoS One. 2016. PMID: 27861552 Free PMC article.
References
-
- Bakker EP, Mangerich WE. N-ethylmaleimide induces K+– H+ antiport activity in Escherichia coli K-12. FEBS Lett. 1982;140:177–180. - PubMed
Publication types
MeSH terms
Substances
Grants and funding
LinkOut - more resources
Full Text Sources
Molecular Biology Databases
