. 2011 Nov;15(11):2421-9.
doi: 10.1111/j.1582-4934.2010.01229.x.

Cathepsins and their endogenous inhibitors cystatins: expression and modulation in multiple sclerosis

Affiliations

Cathepsins and their endogenous inhibitors cystatins: expression and modulation in multiple sclerosis

Dana Haves-Zburof et al. J Cell Mol Med. 2011 Nov.

Abstract

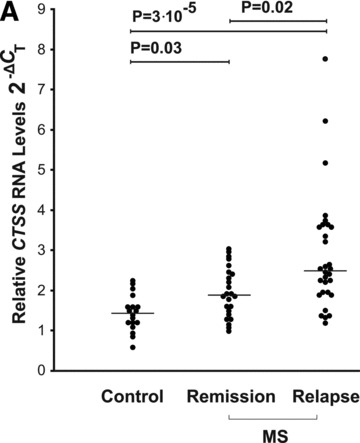
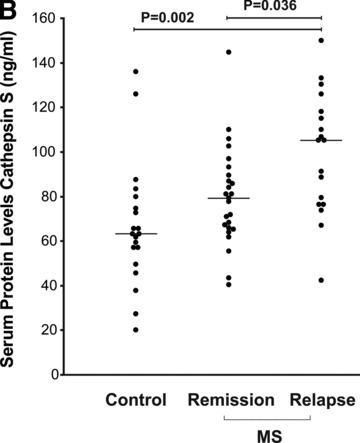
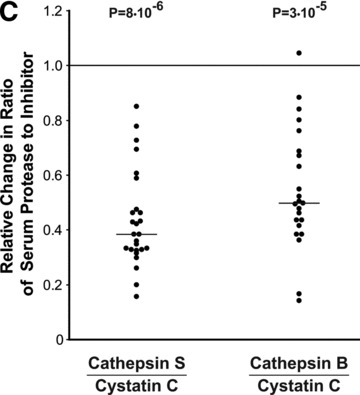
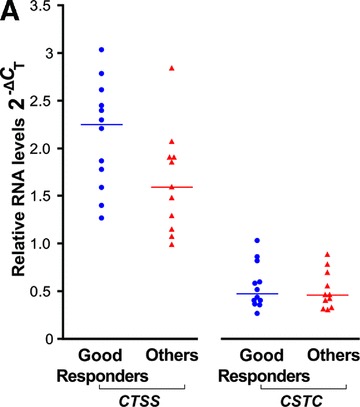
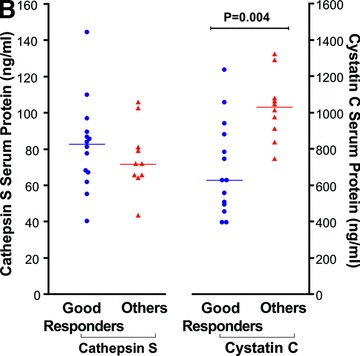
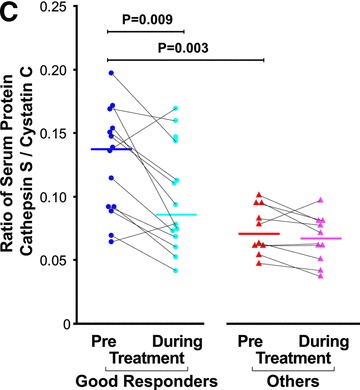
Cathepsins are involved in a variety of physiological processes including antigen processing and presentation and extracellular matrix degradation. In the present study, we evaluated whether expression levels of cathepsins S and B and their inhibitors cystatins B and C are affected by multiple sclerosis (MS) disease state (relapse and remission) and therapies (interferon-β [IFN-β] and the glucocorticoid [GC] methylprednisolone), and whether they are associated with the IFN-β response phenotype. Real-time PCR was employed to compare RNA expression levels in peripheral blood leucocytes (PBLs) and ELISA to determine serum protein levels of MS patients and matched healthy individuals. Cathepsin S RNA was higher in MS patients in the relapse state compared to controls (by 74%, P = 3 × 10(-5), n = 30 versus n = 18) with a similar increase observed in serum (66%, P = 0.002, n = 18 versus n = 20). GC treatment reduced cathepsin S levels in PBL RNA (by 44%, P = 6 × 10(-6), n = 27) and serum proteins (by 27%, P = 1 × 10(-5), n = 26), reduced the serum protein levels of pro-cathepsin B (by 8%, P = 0.0007, n = 23), and in parallel increased the serum levels of their inhibitor cystatin C (by 82%, P = 8 × 10(-6), n = 26). IFN-β therapy significantly elevated the RNA levels (n = 16) of cathepsin B (by 16%, P = 0.03), cystatin B (44%, P = 0.004) and cystatin C (48%, P = 0.011). In the serum, only cathepsin S levels were reduced by IFN-β (16%, P = 0.006, n = 25). Interestingly, pre-treatment serum cathepsin S/cystatin C ratio was higher in 'good responders' to IFN-β therapy compared to patients without a good response (by 94%, P = 0.003). These results suggest that cathepsin S and cystatin C may contribute to disease activity in MS, specifically in a subgroup of patients that are responsive to IFN-β therapy, and that these proteins should be further evaluated as biomarkers in MS.


Figures

Fig 1
Fig 1
Cathepsin S levels in RNA from PBLs and sera of MS patients compared to healthy controls. (A) CTSS mRNA levels in healthy controls (n= 18); MS patients in remission (n= 24) and patients in relapse (n= 30) were assessed by real-time PCR. The 2−ΔCT values shown are relative to GAPDH as a reference gene. (B) ELISA analysis of cathepsin S serum protein levels in healthy controls (n= 20), MS patients in remission (n= 25) or relapse (n= 18) (both groups without immunomodulatory treatment). (C) Ratio of serum cathepsin S/cystatin C in healthy controls (n= 20), MS remission (n= 25) and MS relapse (n= 18) groups. Medians are depicted by horizontal bars.
Fig 1
Fig 1
Cathepsin S levels in RNA from PBLs and sera of MS patients compared to healthy controls. (A) CTSS mRNA levels in healthy controls (n= 18); MS patients in remission (n= 24) and patients in relapse (n= 30) were assessed by real-time PCR. The 2−ΔCT values shown are relative to GAPDH as a reference gene. (B) ELISA analysis of cathepsin S serum protein levels in healthy controls (n= 20), MS patients in remission (n= 25) or relapse (n= 18) (both groups without immunomodulatory treatment). (C) Ratio of serum cathepsin S/cystatin C in healthy controls (n= 20), MS remission (n= 25) and MS relapse (n= 18) groups. Medians are depicted by horizontal bars.
Fig 2
Fig 2
Modulation of cathepsin and cystatin expression by GC therapy in PBLs and serum during the MS relapse. (A) Relative RNA expression levels before and at day 7, following a 6 day IV course of GC treatment were quantified by 2−ΔΔCT values, n= 27 (except for CSTB n= 26). (B) Serum protein levels in day 7 following therapy initiation are depicted relative to pre-treatment values at relapse for cathepsin S (n= 26), pro-cathepsin B (n= 23), cystatin C (n= 26). (C) Changes in the ratios between the proteases and the inhibitor cystatin C in the serum following GC treatment. Horizontal bars: median of fold changes of post-treatment relative to pre-treatment ratios.
Fig 2
Fig 2
Modulation of cathepsin and cystatin expression by GC therapy in PBLs and serum during the MS relapse. (A) Relative RNA expression levels before and at day 7, following a 6 day IV course of GC treatment were quantified by 2−ΔΔCT values, n= 27 (except for CSTB n= 26). (B) Serum protein levels in day 7 following therapy initiation are depicted relative to pre-treatment values at relapse for cathepsin S (n= 26), pro-cathepsin B (n= 23), cystatin C (n= 26). (C) Changes in the ratios between the proteases and the inhibitor cystatin C in the serum following GC treatment. Horizontal bars: median of fold changes of post-treatment relative to pre-treatment ratios.
Fig 3
Fig 3
IFN-β effects on cathepsins and cystatins expression in PBLs and sera from MS patients in remission. (A) Expression levels of cathepsins and cystatins following a 3–6 month period of IFN-β treatment and relative to pre-treatment levels, quantified by 2−ΔΔCT values; n= 16. (B) Cathepsin S serum protein levels before and following a 3–6 month period of IFN-β treatment were analysed by ELISA (n= 27). (C) Ratios between the serum levels of the proteases and the cystatin C inhibitor. Horizontal bars: median of fold changes of during treatment relative to pre-treatment ratios.
Fig 3
Fig 3
IFN-β effects on cathepsins and cystatins expression in PBLs and sera from MS patients in remission. (A) Expression levels of cathepsins and cystatins following a 3–6 month period of IFN-β treatment and relative to pre-treatment levels, quantified by 2−ΔΔCT values; n= 16. (B) Cathepsin S serum protein levels before and following a 3–6 month period of IFN-β treatment were analysed by ELISA (n= 27). (C) Ratios between the serum levels of the proteases and the cystatin C inhibitor. Horizontal bars: median of fold changes of during treatment relative to pre-treatment ratios.
Fig 4
Fig 4
Response phenotype to IFN-β treatment and cathepsin S and cystatin C expression levels. IFN-β treated MS patients were stratified according to their response phenotype. (A) CTSS and CSTC pre-treatment levels relative RNA levels depicted as 2−ΔCT values, compared between ‘good responders’ (blue circles, n= 12) and ‘others’ patient groups (red triangles, n= 11). (B) Serum cathepsin S and cystatin C pre-treatment levels assessed by ELISA in ‘good responders’ (n= 14) and the ‘others’ patient groups (n= 10). (C) Serum cathepsin S to cystatin C ratios in ‘good responders’ (n= 14) and ‘others’ patient groups (n= 10); values prior to IFN-β therapy and 3–6 months after therapy initiation are connected by lines.
Fig 4
Fig 4
Response phenotype to IFN-β treatment and cathepsin S and cystatin C expression levels. IFN-β treated MS patients were stratified according to their response phenotype. (A) CTSS and CSTC pre-treatment levels relative RNA levels depicted as 2−ΔCT values, compared between ‘good responders’ (blue circles, n= 12) and ‘others’ patient groups (red triangles, n= 11). (B) Serum cathepsin S and cystatin C pre-treatment levels assessed by ELISA in ‘good responders’ (n= 14) and the ‘others’ patient groups (n= 10). (C) Serum cathepsin S to cystatin C ratios in ‘good responders’ (n= 14) and ‘others’ patient groups (n= 10); values prior to IFN-β therapy and 3–6 months after therapy initiation are connected by lines.

References

    1. Weiner HL. The challenge of multiple sclerosis: how do we cure a chronic heterogeneous disease. Ann Neurol. 2009;65:239–48. - PubMed
    1. Compston A, Coles A. Multiple sclerosis. Lancet. 2008;372:1502–17. - PubMed
    1. Chandler S, Miller KM, Clements JM, et al. Matrix metalloproteinases, tumor necrosis factor and multiple sclerosis: an overview. J Neuroimmunol. 1997;72:155–61. - PubMed
    1. Agrawal SM, Lau L, Yong VW. MMPs in the central nervous system: where the good guys go bad. Semin Cell Dev Biol. 2008;19:42–51. - PubMed
    1. Galboiz Y, Shapiro S, Lahat N, et al. Matrix metalloproteinases and their tissue inhibitors as markers of disease subtype and response to interferon-beta therapy in relapsing and secondary-progressive multiple sclerosis patients. Ann Neurol. 2001;50:443–51. - PubMed

MeSH terms