. 2011 Jan;119(1):17-35.
doi: 10.1111/j.1600-0463.2010.02688.x. Epub 2010 Oct 25.

Development of gut microbiota in infants not exposed to medical interventions

Affiliations

Development of gut microbiota in infants not exposed to medical interventions

Merete Eggesbø et al. APMIS. 2011 Jan.

Abstract

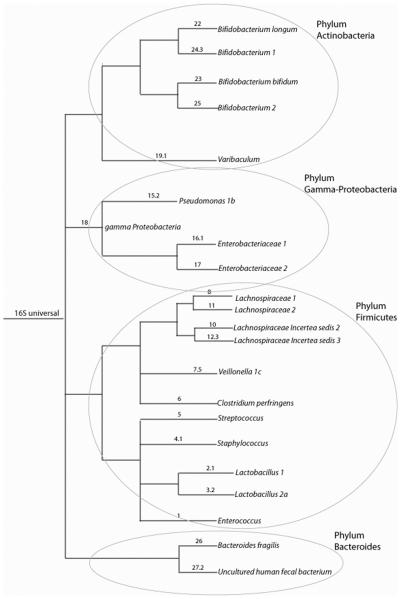
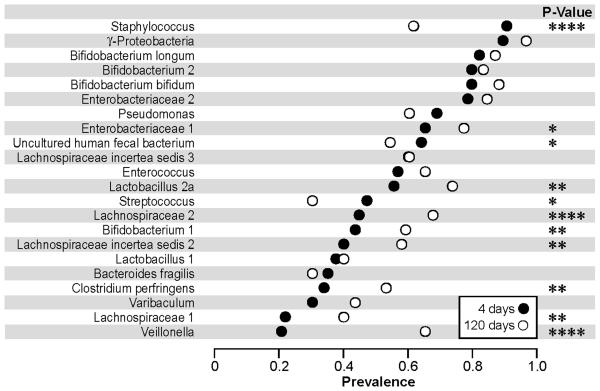
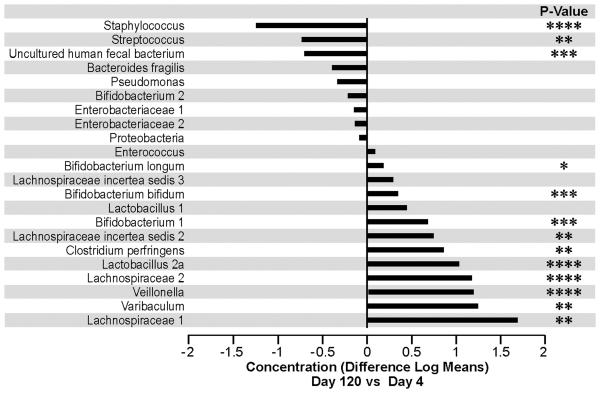
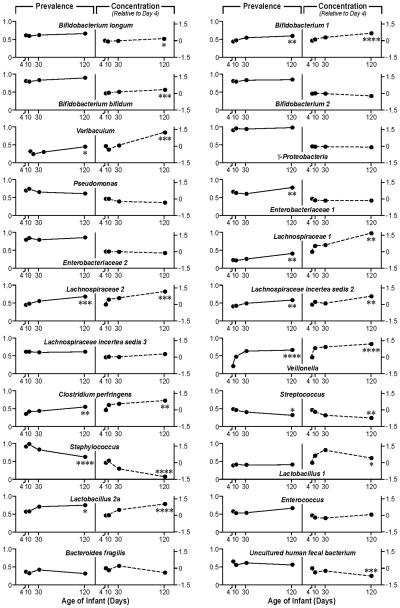
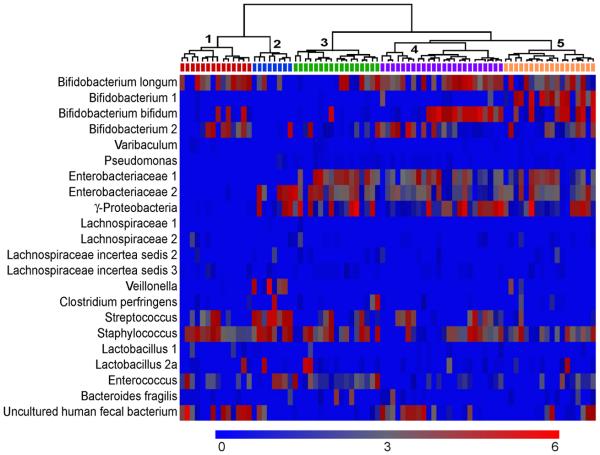
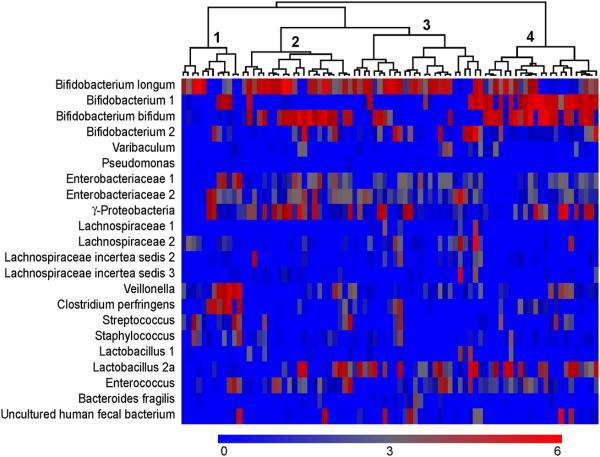
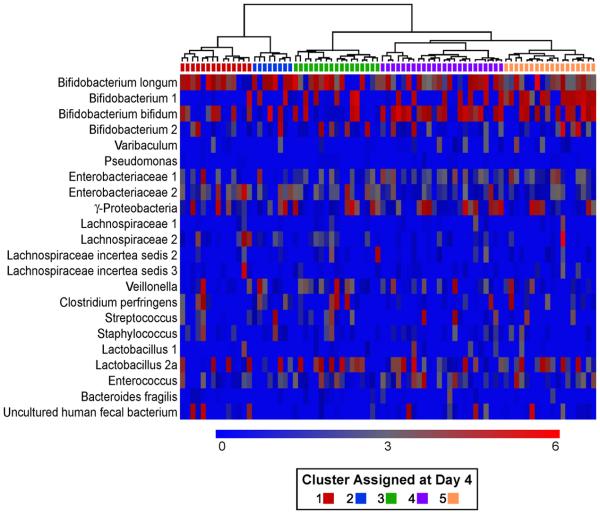
Knowledge of the composition of a normal healthy gut microbiota during infancy is important for understanding the role of gut microbiota in disease. A limitation of previous studies is that they are based on infants who have been subject to factors, which can have a profound disruptive effect on the natural colonization process. We describe the colonization process, during the first 4 months after birth, in 85 infants who have experienced no major medical or dietary interventions. They were all vaginally delivered, healthy, term infants, who were not exposed to antibiotics, exclusively breastfed during their first month of life and at least partially breastfed up to 4 months. Selected microbial groups were identified by targeting small subunit microbial ribosomal RNA genes. In contrast to more recent studies, but in agreement with older studies, almost all our infants harbored γ-Proteobacteria and Bifidobacterium. Yet undefined non-cultivable species belonging to Bacteroides, as well as microbes identified as Lachnospiraceae 2, were common. Strong associations were observed between some specific constituents of microbiota at day 4 and the concentration of specific microbial groups at day 120, indicating that early gut microbiota may influence later microbiota. Novel information of the undisturbed composition of early gut microbiota in babies is presented.


Figures

Figure 1
Figure 1
Cartoon tree representing the phylogenetic grouping of the probes used in the analyses of the data. The numbers before the punctuation for the labeling of branches represent the number of that phylogroup on the array. If there is a number after the punctuation, more than one probe was evaluated for that particular phylogroup. If the naming of the terminal nodes is not distinct we included numbering for distinction.
Figure 2
Figure 2
Prevalence of microbial groups at day 4 and day 120. The percentage of infants in which each microbial group was detected (above threshold) at day 4 (n=83) and at day 120 (n=83) is plotted. Bacterial groups are ordered by mean prevalence at day 4. The p-values are calculated based on 81 infants with data for both days. **** P-value <0.0001, *** p-value <0.001, ** p-value<0.01 and * p-value<0.05.
Figure 3
Figure 3
The mean change in concentration/ expression pattern at day 120 relative to day 4 is shown. Concentrations are defined by log transformed expression intensities. Bacterial groups are ordered by differences in concentrations. * p-value<0.05, ** p-value<0.01 ***, p-value <0.001****, P-value <0.0001.
Figure 4
Figure 4
Prevalence of microbial groups, and changes in concentration. The mean prevalence rate for day 4, 10, 30 and day 120 is plotted, as well as the mean change in concentration/expression pattern for day 10, 30 and 120, all relative to day 4, based on the log scale. We had data from 83, 84, 82 and 83 infants, at age 4, 10, 30 and 120 days, respectively and 77 infants had samples from all four ages. The p-values are calculated based on the 77 infants with full data. * p-value<0.05, ** p-value<0.01 ***, p-value <0.001****, P-value <0.0001.
Figure 5
Figure 5
Heatmap of the concentration of each microbial group for each infant on day 4, with hierarchical clustering among study subjects performed using Spearman correlation coefficients as the similarity index. Each column represents one study subject, and the tree shows the subjects who were clustered together. Wards method was used to form the clusters. The scale of the concentration ranges from 0 concentration (deep blue) to the highest concentration (bright red). (Concentrations should only be compared across individuals and not across probes).
Figure 6
Figure 6
Heatmap of the concentration of each probe on day 120 for each infant, with hierarchical clustering among study subjects performed using Spearman correlation coefficients as the similarity index. Each column represents one study subject, and the tree shows the subjects who were clustered together. Wards method was used to form the clusters. The scale of the concentration ranges from 0 concentration (deep blue) to the highest concentration (bright red). (Concentrations should only be compared across individuals and not across probes)
Figure 7
Figure 7. Clustering of infants at day 120 based on the concentration of microbial groups at day 4
Heatmaps in which the infants have been clustered according to the concentration of microbial group at day 4 (see color code in Figure 5) and these clusters kept at day 120. The color on top of each column, below the tree, shows the cluster the infant has been assigned to at day 4. Hierarchical clustering among study subjects was performed using Spearman correlation coefficients as the similarity index and Ward's method to form the clusters. The scale of the concentration ranges from 0 concentration (deep blue) to the highest concentration (bright red). Concentrations should only be compared across individuals and not across probes.

References

    1. Backhed F, Ley RE, Sonnenburg JL, Peterson DA, Gordon JI. Host-bacterial mutualism in the human intestine. Science. 2005;307:1915–20. - PubMed
    1. Mitsuoka T. Intestinal flora and aging. Nutr Rev. 1992;50:438–46. - PubMed
    1. Round JL, Mazmanian SK. The gut microbiota shapes intestinal immune responses during health and disease. Nat Rev Immunol. 2009;9:313–23. - PMC - PubMed
    1. Turnbaugh PJ, Hamady M, Yatsunenko T, Cantarel BL, Duncan A, Ley RE, et al. A core gut microbiome in obese and lean twins. Nature. 2009;457:480–4. - PMC - PubMed
    1. Bjorksten B, Naaber P, Sepp E, Mikelsaar M. The intestinal microflora in allergic Estonian and Swedish 2-year-old children. Clin Exp Allergy. 1999;29:342–6. - PubMed

Publication types

MeSH terms