. 2010 Dec;64(6):990-1001.
doi: 10.1111/j.1365-313X.2010.04386.x. Epub 2010 Nov 17.

Chromosomal translocations are a common phenomenon in Arabidopsis thaliana T-DNA insertion lines

Affiliations

Chromosomal translocations are a common phenomenon in Arabidopsis thaliana T-DNA insertion lines

Katie A Clark et al. Plant J. 2010 Dec.

Abstract

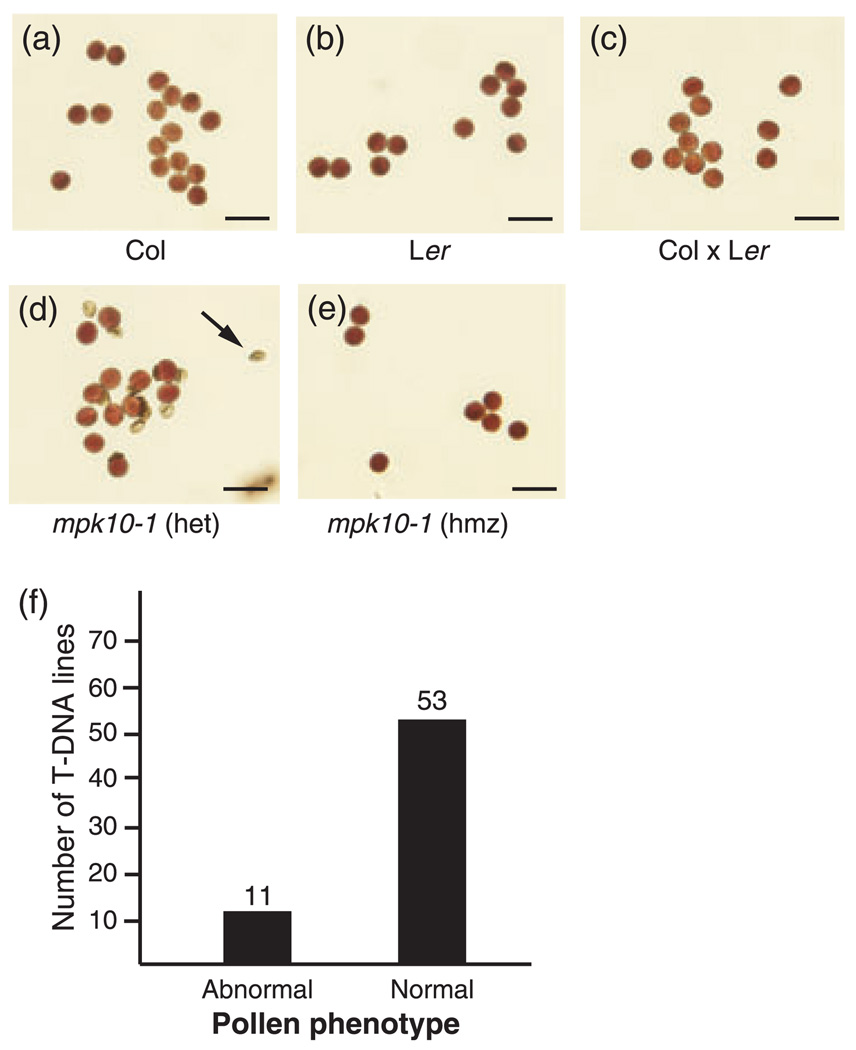
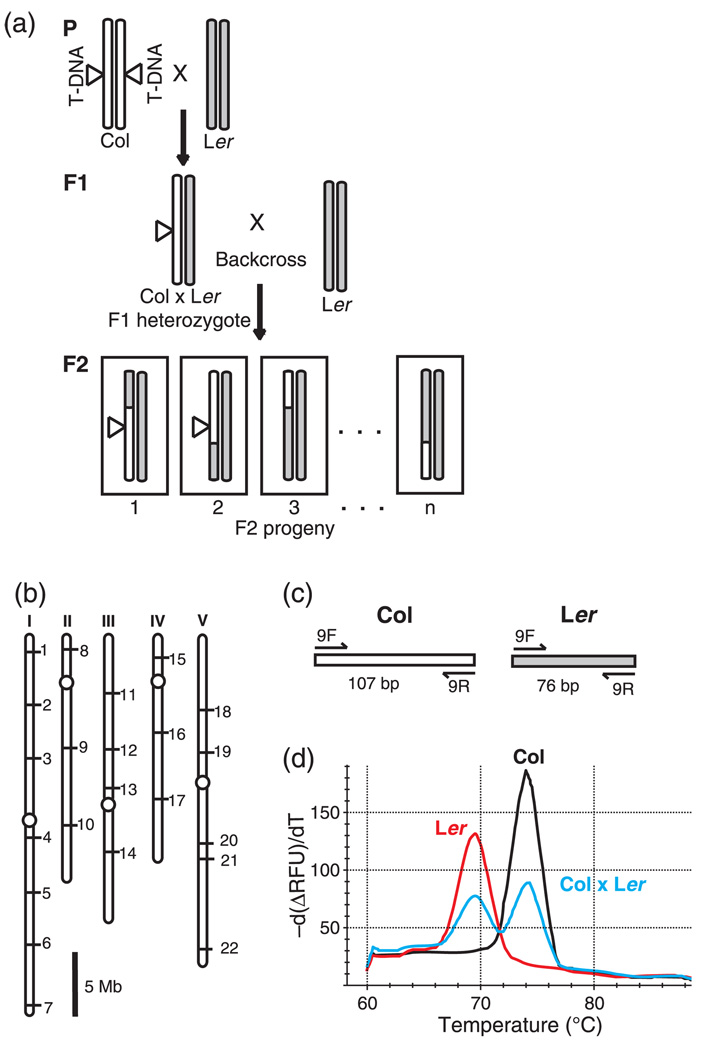
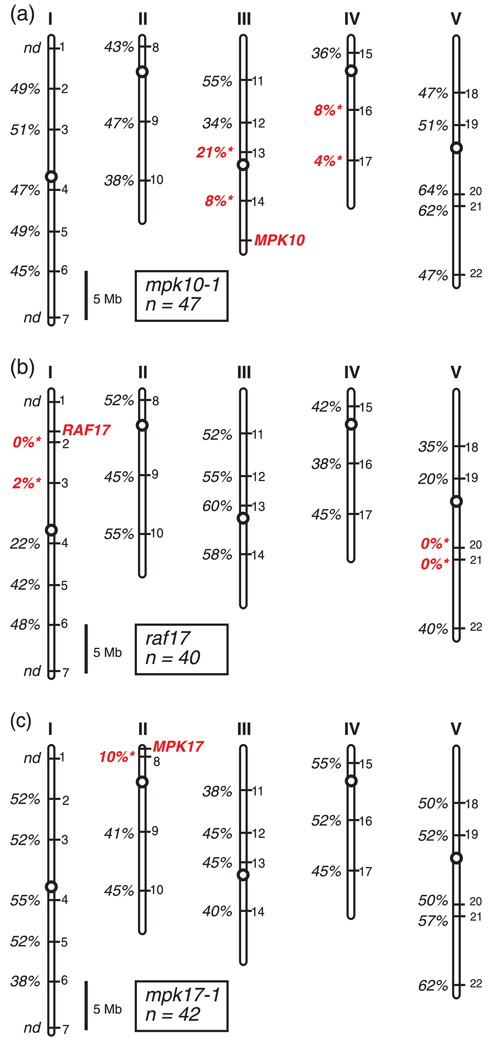
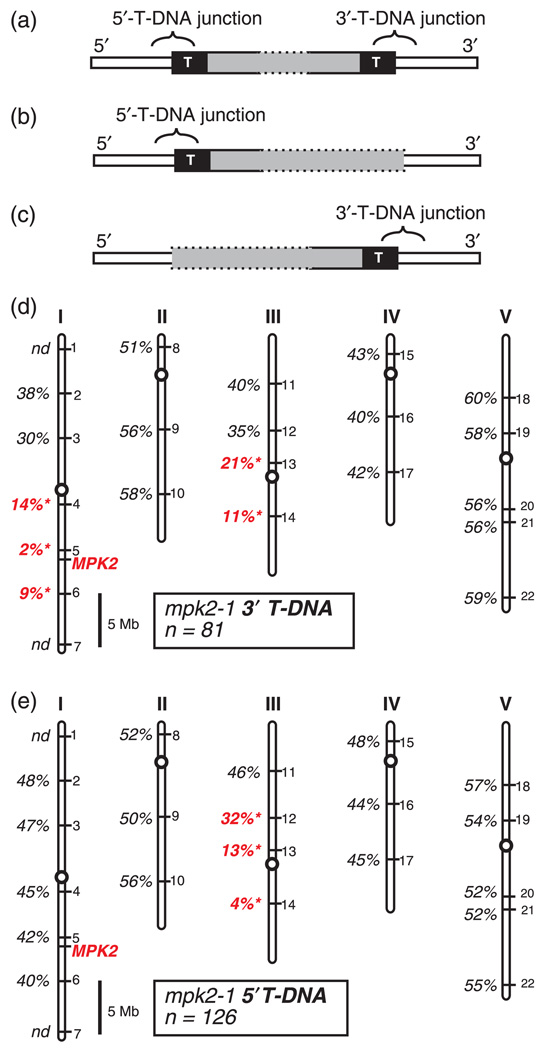
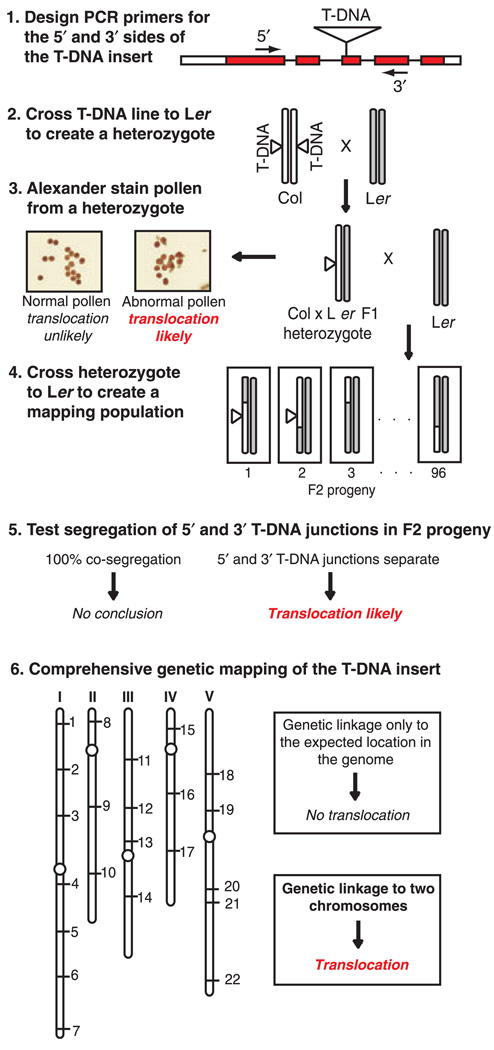
Ordered collections of Arabidopsis thaliana lines containing mapped T-DNA insertions have become an important resource for plant scientists performing genetic studies. Previous reports have indicated that T-DNA insertion lines can have chromosomal translocations associated with the T-DNA insertion site, but the prevalence of these rearrangements has not been well documented. To determine the frequency with which translocations are present in a widely-used collection of T-DNA insertion lines, we analyzed 64 independent lines from the Salk T-DNA mutant collection. Chromosomal translocations were detected in 12 of the 64 lines surveyed (19%). Two assays were used to screen the T-DNA lines for translocations: pollen viability and genome-wide genetic mapping. Although the measurement of pollen viability is an indirect screen for the presence of a translocation, all 11 of the T-DNA lines showing an abnormal pollen phenotype were found to contain a translocation when analyzed using genetic mapping. A normal pollen phenotype does not, however, guarantee the absence of a translocation. We observed one T-DNA line with normal pollen that nevertheless had a translocation based on genetic mapping results. One additional phenomenon that we observed through our genetic mapping experiments was that the T-DNA junctions on the 5'- and 3'-sides of a targeted gene can genetically separate from each other in some cases. Two of the lines in our survey displayed this 'T-DNA borders separate' phenomenon. Experimental procedures for efficiently screening T-DNA lines for the presence of chromosomal abnormalities are presented and discussed.


Figures

Figure 1
Figure 1
Pollen viability screen. (a–e) Alexander stain for pollen viability. Viable pollen grains are round and purple with a green cell wall. Non-viable pollen is green and shriveled, indicated by black arrowhead. The genotypes of the plants that produced the pollen are indicated below each image. Scale bars are 25 µm. (a) Columbia ecotype (Col). (b) Landsberg erecta ecotype (Ler). (c) Columbia × Landsberg erecta F1 heterozygote (Col × Ler). (d) mpk10-1 heterozygote. (e) mpk10-1 homozygous mutant. (f) Pollen phenotype of the 64 Salk T-DNA lines used in this study. ‘Normal’ indicates that the large majority of the pollen produced by a plant heterozygous for the T-DNA insertion was viable. ‘Abnormal’ indicates that ca. 50% of the pollen produced by the heterozygote was non-viable.
Figure 2
Figure 2
Genetic mapping strategy. (a) Creation of the F2 mapping populations. For clarity, only one representative pair of homologous chromosomes is shown. In the parental generation (P), a plant homozygous for a T-DNA insertion (indicated by a triangle) in the Columbia (Col) ecotype is crossed to a wild-type Lansberg erecta (Ler) ecotype plant. The resulting Col × Ler heterozygous plant (F1) is then crossed to another wild-type Ler plant to create a backcrossed mapping population (F2). Example crossover events are indicated in the F2 progeny. Columbia (Col) ecotype chromosomes are white. Landsberg erecta (Ler) ecotype chromosomes are grey. (b) Locations of the insertion/deletion (INDEL) mapping markers INDEL-1 to INDEL-22 on the five Arabidopsis chromosomes (See also Table S1). Scale bar is 5 Megabases. (c) PCR product sizes for mapping marker INDEL-9. Primers (indicated by arrows) with predicted PCR product sizes in base pairs (bp) for Columbia (Col) and Landsberg erecta (Ler) templates. (d) Representative melt-curve genotyping data collected using mapping marker INDEL-9. Melt profiles are shown for INDEL-9 PCR products from plants that are homozygous Columbia (Col), homozygous Landsberg erecta (Ler), and Columbia × Landsberg erecta F1 heterozygote (Col × Ler).
Figure 3
Figure 3
Genetic mapping data for representative T-DNA lines. Locations of the mapping markers INDEL-1 to INDEL-22 on Arabidopsis chromosomes I–V are indicated by numbers on the right-hand side of each chromosome. The physical location of the wild-type gene disrupted by the T-DNA insertion is shown in red. Percent recombination between the T-DNA insert and each mapping marker is shown. ‘nd’ indicates mapping was not done for that marker. A recombination rate significantly different from 50% is indicated in red (P < 0.001). Scale bar is 5 Megabases. (a) Mapping data for the mpk10-1 T-DNA line. (b) Mapping data for the raf17 T-DNA line. (c) Mapping data for the mpk17-1 T-DNA line.
Figure 4
Figure 4
Genetic mapping the 5′- and 3′-T-DNA junctions of mpk2-1, (a–c) Schematic representation of theoretical T-DNA junction configurations. Generic T-DNA insertion loci are depicted with the T-DNA vector sequence indicated by gray, the Arabidopsis chromosome indicated in white, and the T-DNA border sequences represented as black boxes with the letter ‘T.’ (a) LocuswithdetectableT-DNAjunctionsonboththe5′ and 3′sidesofthe gene. (b) Locus with a detectable T-DNA junction on only the 5′ side of the gene. (c) Locus with a detectable T-DNA junction on only the 3′ side of the gene. (d–e) Locations of the mapping markers INDEL-1 to INDEL-22 on Arabidopsis chromosomes I–V are indicated by numbers on the right-hand side of each chromosome. Physical location of the MPK2 gene is shown in red. Percent recombination between each mpk2-1 T-DNA junction and the panel of mapping markers is shown. ‘nd’ indicates mapping not done for that marker. A recombination rate significantly different from 50% is indicated in red (P < 0.001). Scale bar is 5 Megabases. (d) Mapping data for the mpk2-1 5′-T-DNA junction. (e) Mapping data for the mpk2-1 3′-T-DNA junction.
Figure 5
Figure 5
Flow chart outlining a strategy for screening T-DNA lines for the presence of chromosomal translocations. In this example the T-DNA insertion is present in the Columbia ecotype (Col). ‘Abnormal pollen’ refers to the situation where a heterozygous plant produces ca. 50% non-viable pollen. Co-segregation of the 5′ and 3′ T-DNA junctions can only be performed when both junctions are detectable by PCR, which may not be the case with all T-DNA lines.

References

    1. Alexander MP. Differential staining of aborted and nonaborted pollen. Stain Technol. 1969;3:117–122. - PubMed
    1. Alonso JM, Stepanova AN, Leisse TJ, et al. Genome-wide insertional mutagenesis of Arabidopsis thaliana. Science. 2003;301:653–657. - PubMed
    1. Bonhomme S, Horlow C, Vezon D, de Laissardière S, Guyon A, Férault M, Marchand M, Bechtold N, Pelletier G. T-DNA mediated disruption of essential gametophytic genes in Arabidopsis is unexpectedly rare and cannot be inferred from segregation distortion alone. Mol. Gen. Genet. 1998;260:444–452. - PubMed
    1. Budziszewski GJ, Lewis SP, Glover LW, et al. Arabidopsis genes essential for seedling viability: isolation of insertional mutants and molecular cloning. Genetics. 2001;159:1765–1778. - PMC - PubMed
    1. Burnham CR. Genetical and cytological studies of semisterility and related phenomena in maize. Proc. Natl Acad. Sci. USA. 1930;16:269–277. - PMC - PubMed

Publication types