. 2010 Dec 1;11 Suppl 3(Suppl 3):S11.
doi: 10.1186/1471-2164-11-S3-S11.

Robust inference of the context specific structure and temporal dynamics of gene regulatory network

Affiliations

Robust inference of the context specific structure and temporal dynamics of gene regulatory network

Jia Meng et al. BMC Genomics. .

Abstract

Background: Response of cells to changing endogenous or exogenous conditions is governed by intricate molecular interactions, or regulatory networks. To lead to appropriate responses, regulatory network should be 1) context-specific, i.e., its constituents and topology depend on the phonotypical and experimental context including tissue types and cell conditions, such as damage, stress, macroenvironments of cell, etc. and 2) time varying, i.e., network elements and their regulatory roles change actively over time to control the endogenous cell states e.g. different stages in a cell cycle.

Results: A novel network model PathRNet and a reconstruction approach PATTERN are proposed for reconstructing the context specific time varying regulatory networks by integrating microarray gene expression profiles and existing knowledge of pathways and transcription factors. The nodes of the PathRNet are Transcription Factors (TFs) and pathways, and edges represent the regulation between pathways and TFs. The reconstructed PathRNet for Kaposi's sarcoma-associated herpesvirus infection of human endothelial cells reveals the complicated dynamics of the underlying regulatory mechanisms that govern this intricate process. All the related materials including source code are available at http://compgenomics.utsa.edu/tvnet.html.

Conclusions: The proposed PathRNet provides a system level landscape of the dynamics of gene regulatory circuitry. The inference approach PATTERN enables robust reconstruction of the temporal dynamics of pathway-centric regulatory networks. The proposed approach for the first time provides a dynamic perspective of pathway, TF regulations, and their interaction related to specific endogenous and exogenous conditions.


Figures
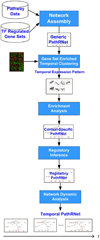
Figure 1
Figure 1
Block diagram of PathRNet Algorithm The construction of PathRNet follows a modular structure, namely generic PathRNet construction, context-specific PathRNet construction, regulatory PathRNet construction, and temporal PathRNet construction.
Figure 2
Figure 2
Choose appropriate value for α Different values of α were used when PATTERN was applied to real data, and the results are compared in terms of A score and C score [18]. We chose α to achieve the highest C score.
Figure 3
Figure 3
Modules identified by ECTDISA ECTDISA can uncover both temporal transcriptional modules (C3) and constant time modules (C1, C2, etc). Starting from 189 initial gene sets, ECTDISA was able to identify 119 clusters in the KSHV infection data, which were further merged into 7 modules. The 3rd module (C3) is a very good example of a temporal module, where genes of the module behave quite differently between 0-3 hours but share a common trend afterwards.
Figure 4
Figure 4
Simulated PathRNet The simulated PathRNet consists of 8 nodes and 5 edges in the generic network, which corresponds to 8 pathways or TFs and 5 regulations. Node 8 is assumed to be regulated by node 1-5 according to prior knowledge but only regulated by node 1 and 2 in the context specific PathRNet. Node 7 is another functional node but does not regulate node 8.
Figure 5
Figure 5
PATTERN on small synthetic PathRNet (a) The vertical axis represents the percentage of correctly predicted network structure and the horizontal axis denotes the noise standard deviation. The capability of PATTERN to recover the correct network structure decreases as noise increases. (b) The plot of the MSE of estimated coefficients vs. the noise standard deviation. PATTERN outperforms the direct method under all tested noise conditions. (c) Plot of the percentage of correctly predicted network structure vs. the percentage of correct annotation is a module. (d) Plot of the the MSE of estimated coefficients vs. the percentage of correct annotation is a module. (c) and (d) suggest that the ability of PATTERN to identify the correct network structure and estimate the coefficients was not significantly affected as long as more than 50% of coregulated genes are correctly annotated.
Figure 6
Figure 6
Precision-Recall curves of (a) nodes and (b) edges of PATTERN on large synthetic PathRNet. PATTERN was applied to a large simulated dataset, which consists of 4000 genes and 14 time samples. The PathRNet embedded consists of 60 nodes (30 functional and 30 nonfunctional) and 175 random edges (connectivity is equal to 5%, which means on average each node is regulated by 3 parent nodes).
Figure 7
Figure 7
Precision-Recall performance of (a) nodes and (b) edges of Pattern for the different noise distributions (small noise variance). PATTERN was applied to a simulated dataset which consists of 400 genes 10 samples. The PathRNet embedded is shown in Fig. 4. Three kinds of noise distributions were added respectively, and the noise standard deviation is equal to 0.05.
Figure 8
Figure 8
Precision-Recall performance of (a) nodes and (b) edges of Pattern for the different noise distributions (large noise variance). PATTERN was applied to a simulated dataset which consists of 400 genes 10 samples. The PathRNet embedded is shown in Fig. 4. Three kinds of noise distributions were added respectively, and the noise standard deviation is equal to 0.4.
Figure 9
Figure 9
Generic PathRNet The generic PathRNet consists of 281 nodes and 1354 edges, which corresponds to 58 signaling pathways, 89 transcription factors, 134 metabolic pathways, and 1354 regulations. The generic PathRNet illustrates a global picture of the interactions between pathways and/or transcription factors in different human cells.
Figure 10
Figure 10
Context-specific PathRNet Context-specific PathRNet consists of 38 nodes and 204 edges, which are 38 enriched or functional pathways or TFs and 204 possible regulations during the KSHV infection of HUVEC.
Figure 11
Figure 11
Plot of noise standard deviation vs. sensitivity of reconstruction at different p-value thresholds. PATTERN was applied to a simulated dataset which consists of 400 genes 10 samples. The PathRNet embedded is shown in Fig. 4. Different p-value thresholds are applied and compared.
Figure 12
Figure 12
Regulatory PathRNet Only nodes that are close to P38 MAPK Signaling pathway or "S-7" are kept (distance<3). The color of the nodes indicates cluster attribute.
Figure 13
Figure 13
Temporal PathRNet (0 - 1 hpi)
Figure 14
Figure 14
Temporal PathRNet (1 - 3 hpi)
Figure 15
Figure 15
Temporal PathRNet (3 - 6 hpi)
Figure 16
Figure 16
Temporal PathRNet (6 - 10 hpi)
Figure 17
Figure 17
Temporal PathRNet (10 - 16 hpi)
Figure 18
Figure 18
Temporal PathRNet (16 - 24 hpi)
Figure 19
Figure 19
Temporal PathRNet (24 - 36 hpi)
Figure 20
Figure 20
Temporal PathRNet (36 - 54 hpi)
Figure 21
Figure 21
Temporal PathRNet (54 - 78 hpi)

Similar articles

Cited by

References

    1. Deisboeck TS. "Personalizing medicine: a systems biology perspective,". Mol Syst Biol. 2009;5:249. doi: 10.1038/msb.2009.8. - DOI - PMC - PubMed
    1. Van Someren EP, Wessels LF, Backer E, Reinders MJ. "Genetic network modeling,". Pharmacogenomics. 2002;vol. 3:pp. 507–25. - PubMed
    1. de Jong H. "Modeling and simulation of genetic regulatory systems: a literature review,". J Comput Biol. 2002;vol. 9:pp. 67–103. doi: 10.1089/10665270252833208. - DOI - PubMed
    1. Shmulevich I, Dougherty ER, Kim S, Zhang W. "Probabilistic Boolean Networks: a rule-based uncertainty model for gene regulatory networks,". Bioinformatics. 2002;vol. 18:pp. 261–74. - PubMed
    1. Jansen R, Yu H, Greenbaum D, Kluger Y, Krogan NJ, Chung S, Emili A, Snyder M, Greenblatt JF, Gerstein M. "A Bayesian networks approach for predicting protein-protein interactions from genomic data,". Science. 2003;vol. 302:pp. 449–53. doi: 10.1126/science.1087361. - DOI - PubMed

Publication types

Substances

LinkOut - more resources