. 2010 Dec 9:4:169.
doi: 10.1186/1752-0509-4-169.

Defining the antigen receptor-dependent regulatory network that induces arrest of cycling immature B-lymphocytes

Affiliations

Defining the antigen receptor-dependent regulatory network that induces arrest of cycling immature B-lymphocytes

Mohammad Sarwar Jamal et al. BMC Syst Biol. .

Abstract

Background: Engagement of the antigen receptor on immature B-lymphocytes leads to cell cycle arrest, and subsequent apoptosis. This is an essential process for eliminating self reactive B cells during its different stages of development. However, the mechanism by which it is achieved is not completely understood.

Results: Here we employed a systems biology approach that combined extensive experimentation with in silico methodologies to chart the network of receptor-activated pathways that mediated the arrest of immature B cells in the G1 phase of the cell cycle. Interestingly, we found that only a sparse network of signaling intermediates was recruited upon engagement of the antigen receptor. This then led to the activation of a restricted subset of transcription factors, with the consequent induction of genes primarily involved in the cell death pathway. Subsequent experiments revealed that the weak initiation of intracellular signaling pathways derived from desensitization of the receptor-proximal protein tyrosine kinase Lyn, to receptor-dependent activation. Intriguingly, the desensitization was a result of the constitutive activation of this kinase in unstimulated cells, which was likely maintained through a regulatory feedback loop involving the p38 MAP kinase. The high basal activity then attenuated the ability of the antigen receptor to recruit Lyn, and thereby also the downstream signaling intermediates. Finally, integration of these results into a mathematical model provided further substantiation to the novel finding that the ground state of the intracellular signaling machinery constitutes an important determinant of the outcome of receptor-induced cellular responses.

Conclusions: Our results identify the global events leading to the G1 arrest and subsequent apoptosis in immature B cells upon receptor activation.


Figures
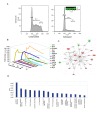
Figure 1
Figure 1
Anti-IgM-dependent stimulation of CH1 cells leads to a poor activation of the signaling responses and induces cell cycle arrest. Panel A shows the histograms representing the distribution of cells in each phase of the cell cycle observed by FACS analysis performed 16 hours after a 1 h stimulation of CH1 cells with anti-IgM. An arrest in cell cycle is clearly evident here, with a greater than 2-fold increase in the G1 phase population. Also shown in the inset is the result of a Western blot analysis revealing accumulation of p27 upon anti-IgM stimulation over the course of time. Panel B depicts the activation profiles of fourteen signaling intermediates probed by Western blots (see text for details and Additional File 1: Supplemental Fig. S1A) after anti-IgM stimulation. The plot represents mean value of quantified, normalized fold change in phosphorylation of the signaling intermediates in a time dependant manner obtained from three individual replicates and the over all S.D observed was < 10%. Also refer Additional File 1: Supplemental Fig. S1B for a detailed plot of the figure. An Ingenuity Pathway Analysis (IPA) of the set of early induced genes upon anti-IgM stimulation of CH1 cells is shown in Panel C. This network depicts the core module identified by IPA based on the list of early-induced genes used as the seed nodes. Here, the nodes in red represent the over-expressed genes while those in green are those whose expression was found to suppressed (Detailed key in Additional file 1). The canonical pathways identified by IPA for the set of early induced genes in CH1 cells and their corresponding significant levels of contribution by the early induced genes is shown in Panel D.
Figure 2
Figure 2
BCR-dependent modulation of TF activities. Panel A shows the representative arrays of transcription factor activation in CH1 cells in response to anti-IgM. Cells were stimulated with anti-IgM and the activation profiles of transcription factors probed by TF array either in unstimulated cells, or in cells stimulated for either 20 or 40 min with anti-IgM. Where, the unstimulated cells were treated as control. Plot in the panel B shows the quantified changes observed in the TF activity upon stimulation of CH1 cells with anti-IgM. Only the subset of TFs that showed >2 fold activation or repression in activity in either of the time points were plotted in log10 scale after. The nomenclature used to denote the TFs are the aliases provided by the array manufacturer, their corresponding Entrez Gene IDs are listed in Additional File 2.
Figure 3
Figure 3
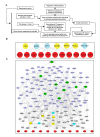
Extracting the BCR-dependent network that regulates the cellular response. The Schematic of the analysis performed to identify the core regulatory network inducing G1 arrest upon anti-IgM stimulation by combining our experimental data and publicly available PPI databases using network analysis is shown in panel A. Panel B depicts the dense overlapping regulatory module identified for TFs regulating the early induced genes due to BCR receptor stimulus. This was achieved by applying TFBS prediction algorithm and literature curation. The red nodes are the early genes induced genes. The yellow nodes represent TFs activated while the blue nodes represent the TFs repressed either at 20 or 40 minutes. Panel C shows the network emanating from BCR that induces changes in the activity of key signaling intermediates analyzed (green nodes) leading to either activation or repression of the set of transcription factors identified from TF array (The nodes are colour coded as in panel B). The nodes in light blue and grey represent other signaling and transcriptional intermediates identified from the network analysis. The set of genes affected due to anti-IgM stimulation are represented as red nodes. All the intermediate nodes are labeled to human orthologs with their corresponding Entrez Gene ID.
Figure 4
Figure 4
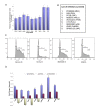
Identifying the key molecular intermediates involved in mediating BCR-dependent cell cycle arrest. Panel A shows the population of G1 arrested cells under RNAi mediated knockdown of early induced genes identified as immature B cell specific. The plot represents mean of three individual replicates with ± S.D. Panel B lists chemical inhibitors screened for protection of CH1 cells from anti-IgM mediated G1 arrest to identify potential regulatory signaling intermediates. Panel C shows the histograms of live population of cells in each of the cell cycle phases under normal anti-IgM stimulation, in presence of p38 inhibitor SB203580 and CaMKII inhibitor KN62. The decrease in the population of G1 arrested cells in both the cases of SB203580 and KN62 could be clearly observed in the histograms. Effect of SB203580 and KN62 on early induced genes one hour after anti-IgM stimulation is shown in panel D. The plot indicates mean value of the fold change in the mRNA levels of the respective genes in log scale obtained from three replicates with ± S.D.
Figure 5
Figure 5
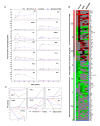
Delineating the core molecular constituents of the BCR-dependent pathways mediating cell cycle arrest. Panel A depicts the time dependent phosphorylation status of signaling intermediates upon anti-IgM stimulation in presence of p38 inhibitor SB203580 and CaMKII inhibitor KN62. Values are mean of three individual experiments with ± S.D. Modulation of Transcription factor activities upon BCR stimulation in the presence of SB203580 and KN62 is shown in panel B. The TF array blots after quantification and normalization are represented as heat map to represents the fold changes in TF activity expressed on a log10 scale. Panel C shows the activity profiles of seven TFs short listed based on their effect of early-induced genes in presence of the p38 and CaMKII inhibitors (see text for details). Shown here are the actual quantitative numbers obtained after image quantification.
Figure 6
Figure 6
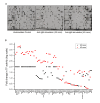
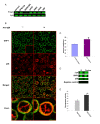
The MAP kinase p38 indirectly regulates the activation status of Lyn. Shown in panel A are phosphorylation levels of Lyn in presence of a panel of inhibitors with Lyn molecule as loading control. The images in panel B confirm the existence of a co-localized pool of p38 and SHP-1 in unstimulated CH1 cells. Further, increase in the extent of co-localization was also observed after anti-IgM stimulation for 5 min. Panel C shows the Pearson's co-localization coefficient for p38 and SHP1 obtained from the images in panel B. Values obtained in both unstimulated and anti-IgM-stimulated (5 min) are plotted. Experiments were performed in triplicates and mean value ±S.D. is plotted (* indicates p-value < 0.05). Panel D shows the results of an experiment where the BCR was immunoprecipitated from either unstimulated, or anti-IgM-stimulated (5 min) cells. Immunoprecipitates were then resolved by gel electrophoresis and then probed for the presence of either p38, SHP-1 or Lyn by Western blot analysis. Results shown confirm that all of these three molecules were associated with the BCR in both unstimulated and stimulated cells. In addition, these results further confirmed the findings of p38-SHP-1 co-localization in panel B and C. The negative control shown represents a Western blot for Lyn in samples where mouse IgM conjugated to agarose was used for the immunoprecipitation. A similar negative result was also obtained when these samples were probed for presence of either p38, or SHP-1 (not shown). Panel E shows phosphatase activity present in immunoprecipitates of the BCR that were obtained from unstimulated cells either in presence or absence (Normal) of the p38 inhibitor SB203580 (Materials and Methods). The assay was performed in triplicates and the mean value (± S.D.) is given, * indicate statistically significant (p-value < 0.05) increase in phosphatase activity in presence of SB203580.
Figure 7
Figure 7
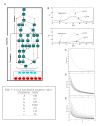
Defining the core regulatory axis and modeling the role of system homeostasis. The molecular interaction map that we derived by combining our experimental data with known literature on BCR signaling is shown in panel A (see text for details). The novel feedback regulation of SHP-1 mediated by p38 that we identified is depicted by red edges. The turquoise nodes represent the seven TFs identified by TF array, and the red nodes are the early induced genes specific to CH1 cells. The signaling intermediates are denoted in green nodes and edge label denote either phosphorylation (pp) or dephosphorylation (dp) regulation. The cascade is classified into signal initiation and propagation sub groups for better understanding. Panel B shows different concentrations of the phopho-Lyn and Syk for different basal values of Lp i., e., Lp*. For the straight line d1 = 0.25 and for the dotted line d1 = 1.1, with other parameter values given in the Table 1. Panel C shows the relation between Lp* and the peak value of the concentration of Lp after stimulation is shown in panel C. Here we vary d1 from 0.23 to 1.2 in the reverse order, with other parameter values as in the Table 1. Panel D shows relation between Lp* and the peak value of the concentration of Sp (after stimulation) by varying d1 for different values of k3 (from 0.001 to 0.01), with other parameter values as in the Table 1. Panel E shows relation between Lp* and the peak value of the concentration of Sp (after stimulation) by varying d1 for different values of d2 (from 0.1 to 0.8), with other parameter values as in the Table 1.

Similar articles

Cited by

References

    1. Kumar D, Srikanth R, Ahlfors H, Lahesmaa R, Rao KV. Capturing cell-fate decisions from the molecular signatures of a receptor-dependent signaling response. Mol Syst Biol. 2007;3:150. doi: 10.1038/msb4100197. - DOI - PMC - PubMed
    1. Miller-Jensen K, Janes KA, Brugge JS, Lauffenburger DA. Common effector processing mediates cell-specific responses to stimuli. Nature. 2007;448(7153):604–608. doi: 10.1038/nature06001. - DOI - PubMed
    1. McKenna NJ, O'Malley BW. Combinatorial control of gene expression by nuclear receptors and coregulators. Cell. 2002;108(4):465–474. doi: 10.1016/S0092-8674(02)00641-4. - DOI - PubMed
    1. Ma'ayan A. Insights into the organization of biochemical regulatory networks using graph theory analyses. J Biol Chem. 2009;284(9):5451–5455. - PMC - PubMed
    1. Barabasi AL, Oltvai ZN. Network biology: understanding the cell's functional organization. Nat Rev Genet. 2004;5(2):101–113. doi: 10.1038/nrg1272. - DOI - PubMed

Publication types

MeSH terms