. 2010 Dec 10:3:57.
doi: 10.1186/1755-8794-3-57.

Disease-associated alleles in genome-wide association studies are enriched for derived low frequency alleles relative to HapMap and neutral expectations

Affiliations

Disease-associated alleles in genome-wide association studies are enriched for derived low frequency alleles relative to HapMap and neutral expectations

Joseph Lachance. BMC Med Genomics. .

Abstract

Background: Genome-wide association studies give insight into the genetic basis of common diseases. An open question is whether the allele frequency distributions and ancestral vs. derived states of disease-associated alleles differ from the rest of the genome. Characteristics of disease-associated alleles can be used to increase the yield of future studies.

Methods: The set of all common disease-associated alleles found in genome-wide association studies prior to January 2010 was analyzed and compared with HapMap and theoretical null expectations. In addition, allele frequency distributions of different disease classes were assessed. Ages of HapMap and disease-associated alleles were also estimated.

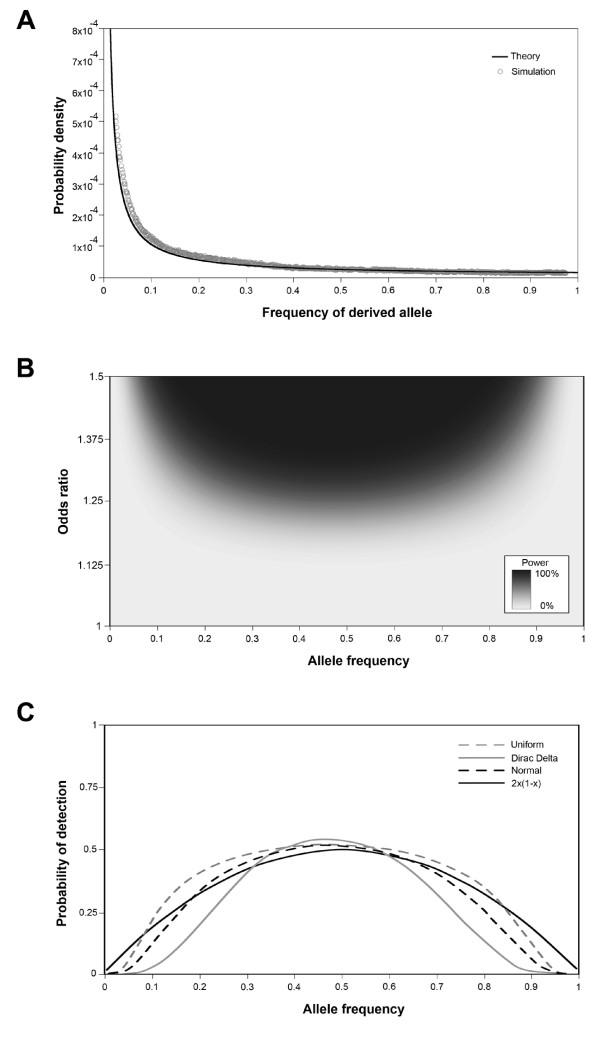
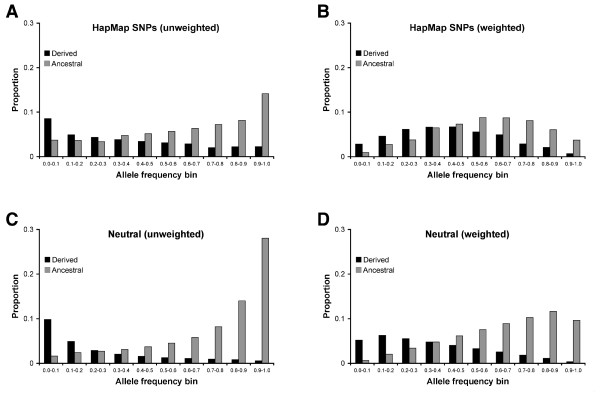
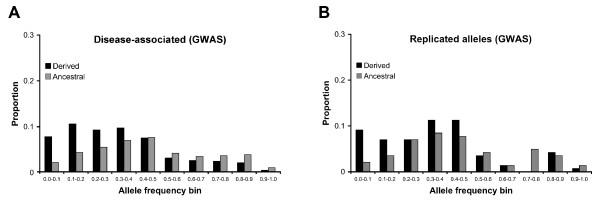
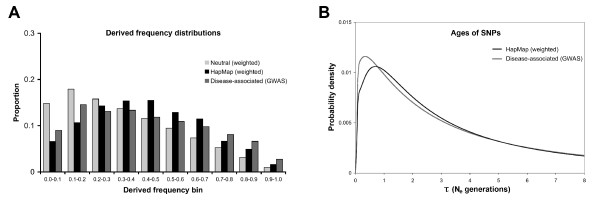
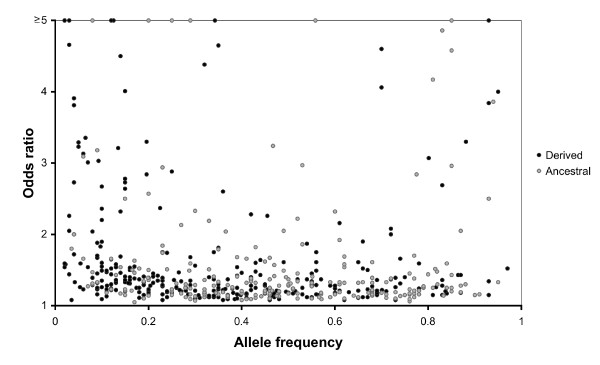
Results: The allele frequency distribution of HapMap alleles was qualitatively similar to neutral expectations. However, disease-associated alleles were more likely to be low frequency derived alleles relative to null expectations. 43.7% of disease-associated alleles were ancestral alleles. The mean frequency of disease-associated alleles was less than randomly chosen CEU HapMap alleles (0.394 vs. 0.610, after accounting for probability of detection). Similar patterns were observed for the subset of disease-associated alleles that have been verified in multiple studies. SNPs implicated in genome-wide association studies were enriched for young SNPs compared to randomly selected HapMap loci. Odds ratios of disease-associated alleles tended to be less than 1.5 and varied by frequency, confirming previous studies.

Conclusions: Alleles associated with genetic disease differ from randomly selected HapMap alleles and neutral expectations. The evolutionary history of alleles (frequency and ancestral vs. derived state) influences whether they are implicated in genome-wide association studies.


Figures

Figure 1
Figure 1
Neutral expectations, statistical power, and probability of detection. A) Unweighted probability density of derived allele frequencies under the neutral theory. Calculations use Equation 1 and are represented by a black line. MATLAB simulation data is represented by grey circles. B) Statistical power of GWAS plotted as a function of odds ratio and allele frequency. Darker shading indicates greater statistical power. Parameter values: 2500 cases and controls, a p-value of 5 × 10⁻⁸, complete linkage, multiplicative dominance. C) Probability of detecting a disease-associated allele. Three distributions of odds ratios are considered: uniform (evenly distributed odds ratios between 1.0 and 1.5, dashed grey line), Dirac delta (every allele has an odds ratio of 1.25, solid grey line), and normal (mean 1.25, standard deviation = 0.1, dashed black line). Equation 6 is plotted as a solid black line.
Figure 2
Figure 2
Allele frequency distributions for null expectations. Allele frequencies are binned into 0.10 intervals. Derived probabilities are labelled in black and ancestral probabilities are labelled in grey. Neutral expectations use a polymorphism threshold (d) of 0.025. A) Allele frequency distributions for HapMap alleles prior to detection (n = 1000). B) Allele frequency distributions for HapMap alleles after weighting by the probability of detection (n = 1000). C) Theoretical allele frequency distributions for neutral alleles prior to detection. D) Theoretical allele frequency distributions for neutral alleles after weighting by the probability of detection.
Figure 3
Figure 3
Allele frequency distributions for GWAS data. Allele frequencies are binned into 0.10 intervals. Derived probability densities are labelled in black and ancestral probability densities are labelled in grey. A) All disease-associated alleles (n = 1143). B) Disease-associated alleles that have been implicated in multiple studies (n = 142).
Figure 4
Figure 4
Characteristics of different types of loci. A) Derived frequency distributions. Derived allele frequencies are binned into 0.10 intervals and probability densities for different types of loci are indicated by shading (neutral expectations in light grey, HapMap SNPs in black, and disease-associated GWAS SNPs in dark grey). Similar numbers of loci were analyzed for each data type (1000 for neutral expectations and HapMap SNPs, and 1143 for GWAS SNPs). B) Estimated ages of SNPs. The probability density for HapMap SNPs (weighted by probability of detection) is labelled black and the probability density for disease-associated GWAS SNPs is labelled dark grey. Probability densities were obtained via Equation 12, and calculated at intervals of 0.04 Ne generations.
Figure 5
Figure 5
Odds ratios for ancestral and derived alleles as a function of allele frequency. Derived alleles are represented by black circles, and ancestral alleles are represented by grey circles. A total of 530 alleles have odds ratio data.

Similar articles

Cited by

References

    1. Altshuler D, Daly MJ, Lander ES. Genetic mapping in human disease. Science. 2008;322(5903):881–888. doi: 10.1126/science.1156409. - DOI - PMC - PubMed
    1. Wellcome Trust Case Control Consortium. Genome-wide association study of 14,000 cases of seven common diseases and 3,000 shared controls. Nature. 2007;447(7145):661–678. doi: 10.1038/nature05911. - DOI - PMC - PubMed
    1. Kotowski IK, Pertsemlidis A, Luke A, Cooper RS, Vega GL, Cohen JC, Hobbs HH. A spectrum of PCSK9 Alleles contributes to plasma levels of low-density lipoprotein cholesterol. American Journal of Human Genetics. 2006;78(3):410–422. doi: 10.1086/500615. - DOI - PMC - PubMed
    1. Tomlinson I, Webb E, Carvajal-Carmona L, Broderick P, Kemp Z, Spain S, Penegar S, Chandler I, Gorman M, Wood W. et al.A genome-wide association scan of tag SNPs identifies a susceptibility variant for colorectal cancer at 8q24.21. Nature Genetics. 2007;39(8):984–988. doi: 10.1038/ng2085. - DOI - PubMed
    1. Todd JA, Walker NM, Cooper JD, Smyth DJ, Downes K, Plagnol V, Bailey R, Nejentsev S, Field SF, Payne F. et al.Robust associations of four new chromosome regions from genome-wide analyses of type 1 diabetes. Nature Genetics. 2007;39(7):857–864. doi: 10.1038/ng2068. - DOI - PMC - PubMed

Publication types

LinkOut - more resources