. 2011 Jan;37(1):78-86.
doi: 10.1016/j.ultrasmedbio.2010.10.002.

Examining and analyzing subcellular morphology of renal tissue treated by histotripsy

Affiliations

Examining and analyzing subcellular morphology of renal tissue treated by histotripsy

Frank Winterroth et al. Ultrasound Med Biol. 2011 Jan.

Abstract

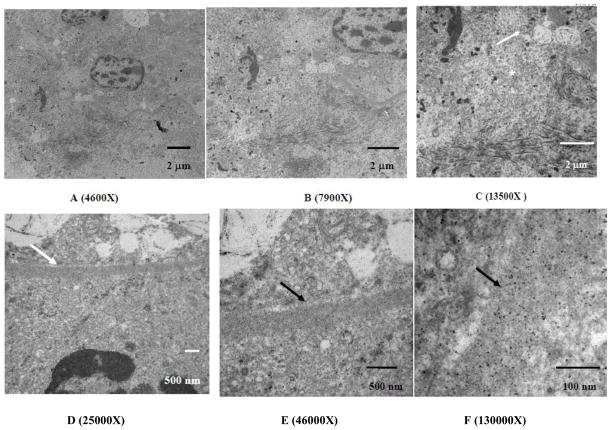
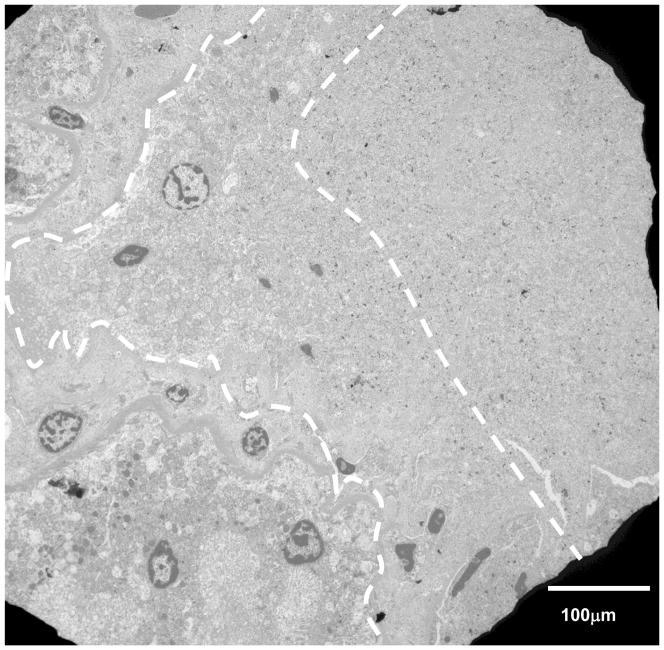
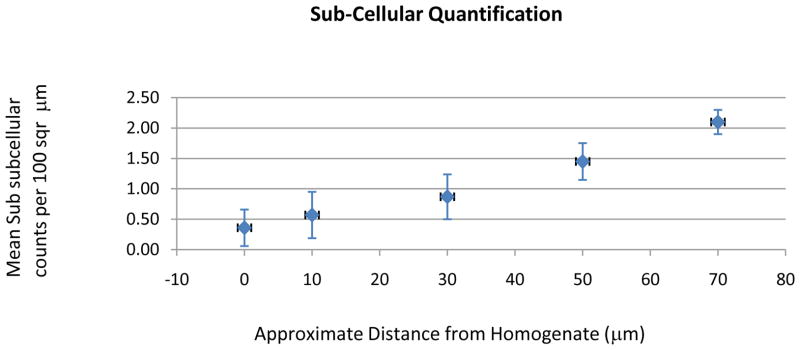
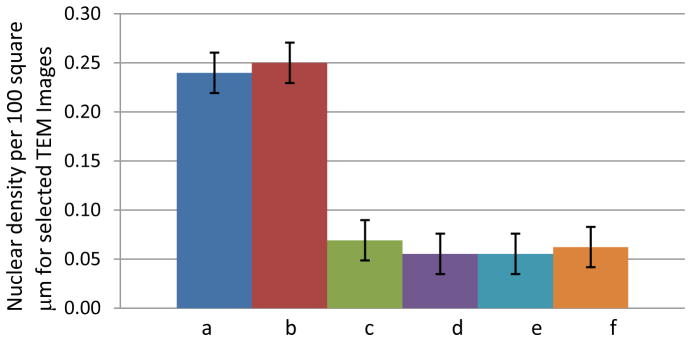
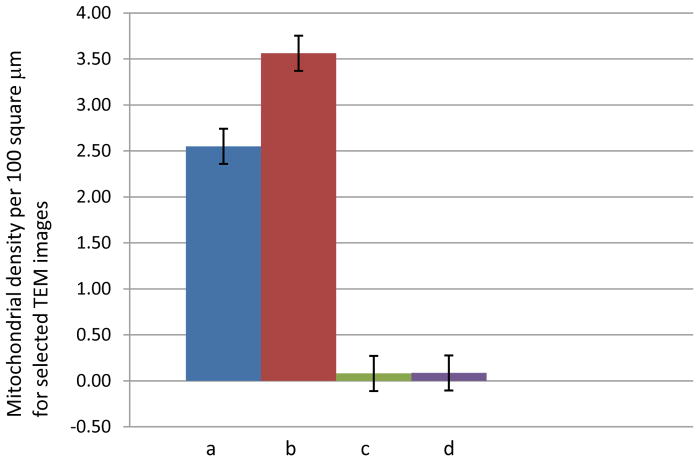
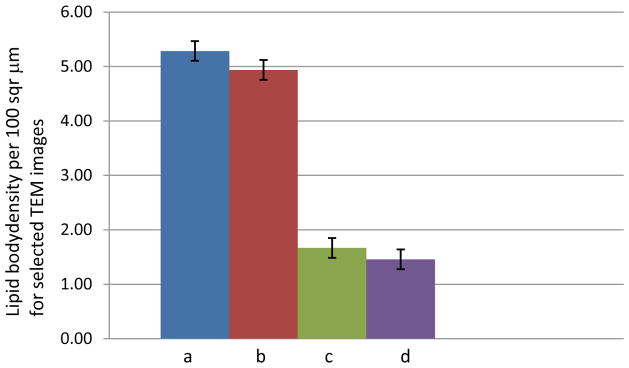
Our recent studies have shown that high-intensity pulsed ultrasound can achieve mechanical tissue fragmentation, a process we call histotripsy. Histotripsy has many medical applications where noninvasive tissue removal or significant tissue disruption is needed (e.g., cancer therapy). The primary aim of this study is to investigate tissue regions treated by histotripsy and to characterize the boundary between the treated and untreated zones using transmission electron microscopy (TEM). The nature of the tissue disruption suggests many clinical applications and provides insights on the physical mechanism of histotripsy. Fresh ex vivo porcine kidney tissues were treated using histotripsy. A 1 MHz 100 mm diameter focused transducer was used to deliver 15 cycle histotripsy pulses at a peak negative pressure of 17 MPa and a pulse repetition frequency (PRF) of 100 Hz. Each lesion was produced by a 3 × 3 (lateral) × 4 (axial) grid with 2 mm between adjacent lateral and 3 mm between axial exposure points using mechanical scanning. Two thousand pulses were applied to each exposure point to achieve tissue fragmentation. After treatment, the tissue was processed and examined using TEM. Extensive fragmentation of the tissues treated with histotripsy was achieved. TEM micrographs of the tissue treated by histotripsy, showing no recognizable cellular features and little recognizable subcellular structures, demonstrates the efficacy of this technique in ablating the targeted tissue regions. A boundary, or transition zone, of a few microns separated the affected and unaffected areas, demonstrating the precision of histotripsy tissue targeting. TEM micrographs of the tissue treated by histotripsy showed no discernable cellular structure within the treated region. Histotripsy can minimize fragmentation of the adjoining nontargeted tissues because, as a nonlinear threshold phenomenon, damage can be highly localized. The potential for high lesion precision is evident in the TEM micrographs.


Figures

Figure 1
Figure 1
Measured pressure waveform generated from therapeutic ultrasound. Ultrasound used to perform histotrispy has 1MHz 15 cycle pulses delivered at a PRF of 100Hz and peak negative pressure of 19MPa.
Figure 2
Figure 2
Cross section of the kidney cortex. Boxed area indicates the region where histotripsy was applied: this was determined by measuring the region’s proximity to the edge of the kidney and comparing its distance to that measured when viewed with ultrasound imaging.
Figure 3
Figure 3
Histology of the kidney cortex showing an acellular treated area (asterisk) adjacent to normal appearing tissues consisting of tubules and glomeruli.
Figure 4
Figure 4
1450X Detail of the kidney cortex under TEM showing the margin between region affected by ultrasound (A) and the unaffected area (U). Note the nuclei in the affected region appear pyknotic and there is little presence of subcellular features compared to the unaffected region.
Figure 5
Figure 5
TEM of untreated kidney cortex between 800X – 4400X, showing the intact convoluted tubules and red blood cells are clearly visible within the interstitial blood vessels. At higher magnification, the organelles are seen fully intact within the structural cells of each tubule and the cell membranes are also visible.
Figure 6
Figure 6
TEM micrographs of the kidney cortex after histotripsy treatment at the border adjacent to the homogenized region. The material in the lower right in both micrographs is the remnant of the homogenized cells, with a fragment of pyknotic nucleus remaining. The upper half of images A and B shows a cell immediately adjacent to the homogenized area appearing to show a transition between homogenate and completely intact. At 13500X magnification (C), there is a noticeable change in the morphology between the fully intact mitochondria (arrow) and the fragmented mitochondria within the homogenized region (asterisk). The homogenized area also includes keratin fragments in the lower half of the image. Other sub-cellular constituents such as endoplasmic reticulum, Golgi, lysosomes, and the cell membrane are not visible within the homogenized area. Images of the basal lamina magnified between 25000X up to 130000X (D–F) show the basal lamina (arrows) appearing intact, with no transition of fractionation. This is in spite of being within the histotripsy-treated region where the sub-cellular material within its confines appears to have been been disrupted.
Figure 7
Figure 7
TEM micrograph of the kidney cortex at 1450X magnification. The dashed white lines represent the approximate boundary between the treated and untreated regions and a transition in the morphology of the subcellular material is clearly evident: there is a clear absence of membranes and other subcellular features. Nuclei appear pyknotic and there is less presence of mitochondria (the two more robust organelles). To the right of the region, there are less recognizable subcellular features; to the left, the cellular material is more clearly defined.
Figure 8
Figure 8
Data correlating the mean number of sub-cellular components per 100 μm2 within the kidney tissues to the average distance from the treated region. The data is based on n = 4.
Figure 9
Figure 9
Figure 9A. Comparing nuclear densities per 100 μm2 between the untreated control kidneys (a-b) and treated areas adjacent to the homogenate border (c–f); n = 4 for each organelle. Figure 9B. Comparing mitochondrial densities per 100 μm2 between the untreated control kidneys (a–b) and treated areas adjacent to the homogenate border (c–d); n = 4 for each organelle. Figure 9C. Comparing lipid body densities per 100 μm2 between the untreated control kidneys (a–b) and treated areas adjacent to the homogenate border (c–d); n = 4 for each organelle.
Figure 9
Figure 9
Figure 9A. Comparing nuclear densities per 100 μm2 between the untreated control kidneys (a-b) and treated areas adjacent to the homogenate border (c–f); n = 4 for each organelle. Figure 9B. Comparing mitochondrial densities per 100 μm2 between the untreated control kidneys (a–b) and treated areas adjacent to the homogenate border (c–d); n = 4 for each organelle. Figure 9C. Comparing lipid body densities per 100 μm2 between the untreated control kidneys (a–b) and treated areas adjacent to the homogenate border (c–d); n = 4 for each organelle.

References

    1. Anderson CD, Lin W-C, Beckham J, Mahadevan-Jansen A, Buttemere CR, Pierce J, Nicoud IB, Pinson CW, Chari RS. Fluorescence Spectroscopy Accurately Detects Irreversible Cell Damage During Hepatic Radiofrequency Ablation. Surgery. 2004 Sep;136(3):524–31. - PubMed
    1. Back W, Kohrmann KU, Bensemann J, Rassweiler J, Alken P. Histomorphologic and Ultrastructural Findings of Shockwave-Induced Lesions in the Isolated Perfused Kidney of the Pig. J Endourol. 1994;8(4):257–261. - PubMed
    1. Crosier AE, Farin PW, Dykstra MJ, Alexander JE, Farin C. Ultrastructural Morphometry of Bovine Blastocysts Produced In Vivo or In Vitro. Biol Reprod. 2001;64:1375–1385. - PubMed
    1. Glamoclija V, Vilović K, aga-Babić M, Baranović A, Sapunar D. Apoptosis and Active Caspase-3 Expression in Human Granulosa Cells. Fertil Steril. 2005;83:426–31. - PubMed
    1. Hsu THS, Fidler ME, Gill IS. Radiofrequency Ablation of the Kidney: Acute and Chronic Histology in Porcine Model. Urol. 2000;56:872–875. - PubMed

Publication types