. 2010 Dec 9;68(5):936-47.
doi: 10.1016/j.neuron.2010.09.004.

M1 muscarinic receptors boost synaptic potentials and calcium influx in dendritic spines by inhibiting postsynaptic SK channels

Affiliations

M1 muscarinic receptors boost synaptic potentials and calcium influx in dendritic spines by inhibiting postsynaptic SK channels

Andrew J Giessel et al. Neuron. .

Abstract

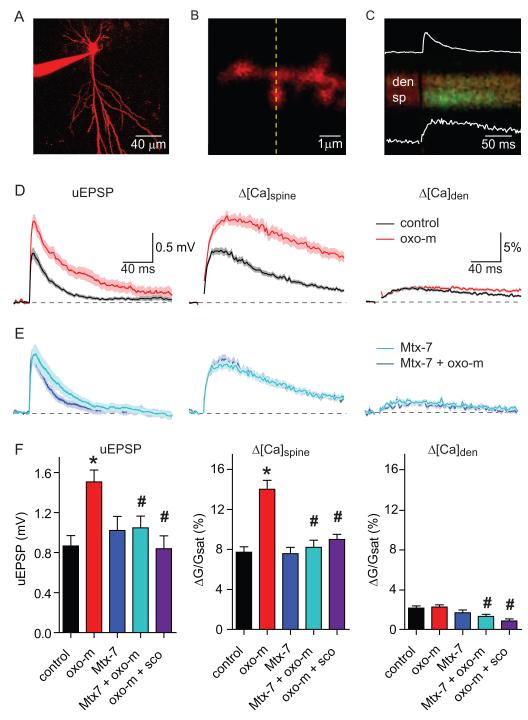
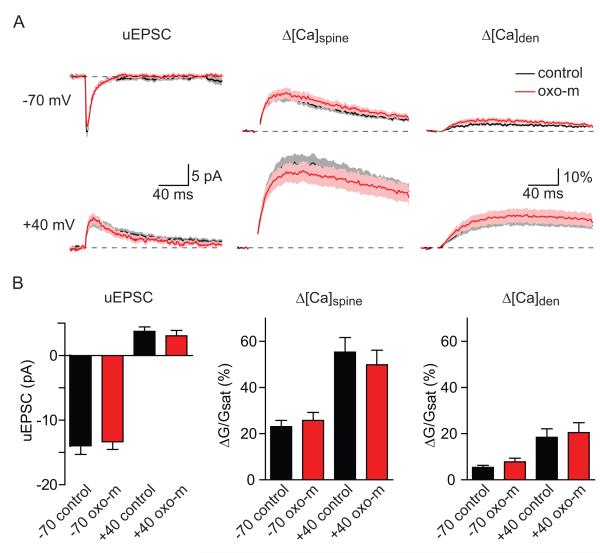
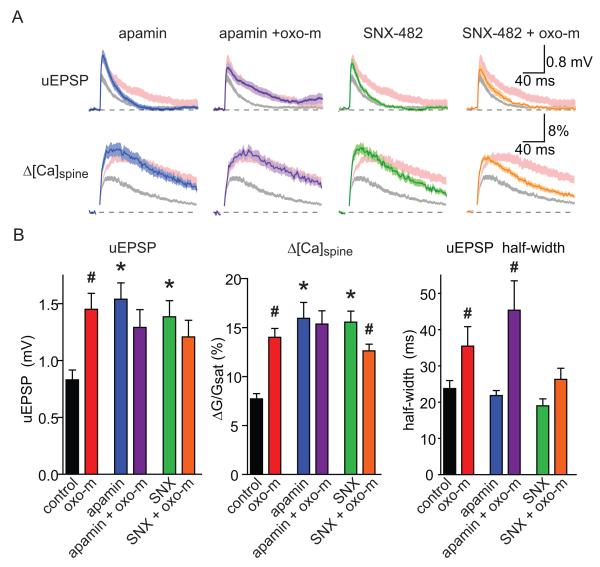
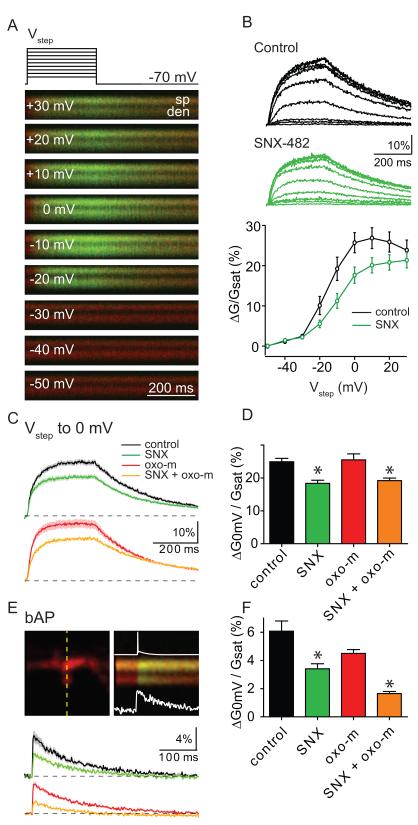
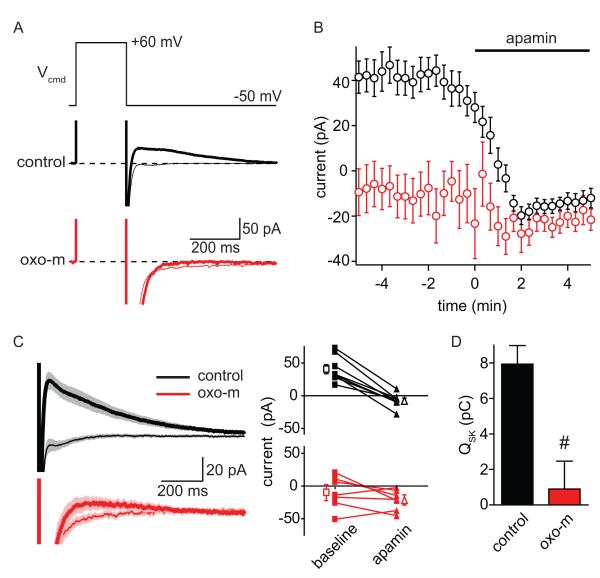
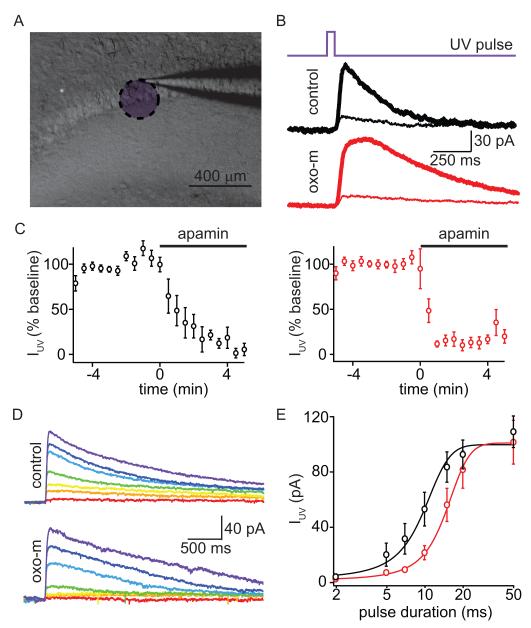
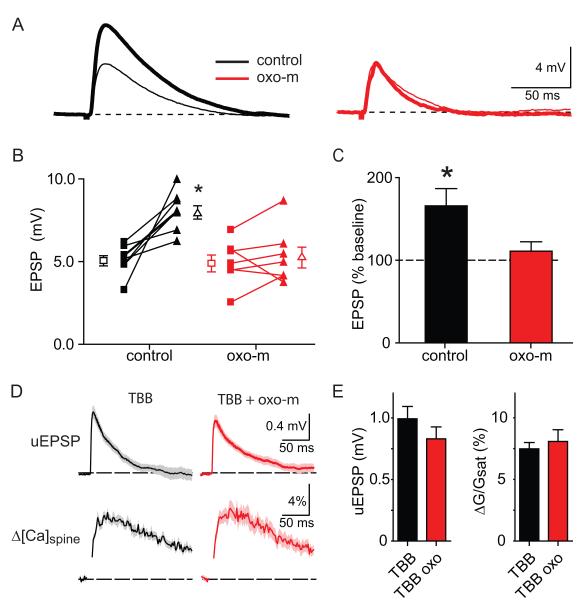
Acetylcholine release and activation of muscarinic cholinergic receptors (mAChRs) enhance synaptic plasticity in vitro and cognition and memory in vivo. Within the hippocampus, mAChRs promote NMDA-type glutamate receptor-dependent forms of long-term potentiation. Here, we use calcium (Ca) imaging combined with two-photon laser glutamate uncaging at apical spines of CA1 pyramidal neurons to examine postsynaptic mechanisms of muscarinic modulation of glutamatergic transmission. Uncaging-evoked excitatory postsynaptic potentials and Ca transients are increased by muscarinic stimulation; however, this is not due to direct modulation of glutamate receptors. Instead, mAChRs modulate a negative feedback loop in spines that normally suppresses synaptic signals. mAChR activation reduces the Ca sensitivity of small conductance Ca-activated potassium (SK) channels that are found in the spine, resulting in increased synaptic potentials and Ca transients. These effects are mediated by M1-type muscarinic receptors and occur in a casein kinase-2-dependent manner. Thus, muscarinic modulation regulates synaptic transmission by tuning the activity of nonglutamatergic postsynaptic ion channels.


Figures

Figure 1
Figure 1. Synaptic potentials and Ca transients evoked at individual dendritic spines of CA1 pyramidal neurons are enhanced by activation of mAChRs
A, Image of a CA1 hippocampal pyramidal neuron formed from the red fluorescence of Alexa Fluor-594. B, High-magnification image of a spiny dendrite. C, Example of fluorescence collected during line scans, as indicated by the dashed line in (B), that intersect the spine head (sp) and neighboring dendrite (den) during uncaging of glutamate near the spine head. The increase in green fluorescence indicates an increase in intracellular [Ca]. The inset white traces show the simultaneously recorded uEPSP (top, amplitude 0.9 mV) and the quantification of the green fluorescence in the spine head (bottom, amplitude 10.8% ΔG/Gsat) D, uEPSPs (left) and Ca-dependent changes in fluorescence measured in the spine head (middle) and neighboring dendrite (right) evoked by uncaging glutamate in control conditions (black) and in the presence of oxo-m (red). In this and all subsequent figures, data are shown as the mean (line) ± SEM (shaded region). E, uEPSPs (left) and Ca-dependent changes in fluorescence measured in the spine head (middle) and neighboring dendrite (right) evoked by uncaging glutamate in the presence of Mtx-7 (dark blue) and in the additional presence of oxo-m (light blue). F, Summary of amplitudes of uEPSPs (left), Δ[Ca]spine (middle), and Δ[Ca]den (right) measured in control conditions (black), in the presence of oxo-m (red), M1 receptor antagonist Mtx-7 (blue), Mtx-7 and oxo-m (light blue), and scopolamine and oxo-m (purple). * indicates a significant difference from control (p<0.05), # indicates a significant difference from oxo-m alone (p<0.05).
Figure 2
Figure 2. Current through AMPARs and NMDARs and the Ca permeability of NMDARs are unaffected by activation of mAChRs
A, uEPSCs (left), Δ[Ca]spine (middle), and Δ[Ca]den (right) evoked by stimulating individual spines while holding the cell at −70 mV (top) and +40 mV (bottom). Black and red traces are in control conditions and in the presence of oxo-m, respectively. B, Summary of amplitudes of uEPSCs (left), Δ[Ca]spine (middle), and Δ[Ca]den (right) measured in the conditions described above.
Figure 3
Figure 3. The effects of mAChR activation on synaptic potentials and Ca influx are mimicked and occluded by antagonism of CaV2.3 or SK channels
A, uEPSPs (top) and Δ[Ca]spine (bottom) measured in the presence of apamin (far left, blue), apamin + oxo-m (left, purple), SNX-482 (right, green), and SNX-482 + oxo-m (far right, orange). The ranges of responses measured in control conditions and in the presence of oxo-m are shown for comparison in shaded gray and pink, respectively. B, Summary of amplitudes of uEPSPs (left), Δ[Ca]spine (middle), and uEPSP half-width (right) measured in the conditions shown in panel A. For conditions without oxo-m, * indicates a significant difference from control (p<0.05). For conditions with oxo-m, # indicates a significant difference between the indicated condition and the same without oxo-m (p<0.05).
Figure 4
Figure 4. Activation of mAChRs does not enhance CaV2.3 mediated Ca influx into active spines
A, top, Voltage-step protocol showing 300 ms steps to −50, −40, −30, −20, −10, 0, +10, +20 and +30 mV from a holding potential of −70 mV. bottom, Example series of fluorescence transients evoked by steps to the indicated potentials measured in line scans intersecting a spine head (sp) and neighboring dendrite (den). B, top, Average fluorescence transients measured as in panel A showing depolarization-dependent Ca influx into the spine head in control (black) and in the presence of SNX-482 (green). bottom, summary data for Δ[Ca]spine measured as in panel A in control (black) and SNX-482 (green). C, top, Average fluorescence transients for voltage steps to 0 mV in control (black) and SNX-482 (green). bottom, as above, but in the presence of oxo-m (red) and SNX-482+oxo-m (orange). D, Summary of ΔG/Gsat in response to voltage-steps to 0 mV measured in the four pharmacological conditions shown in C. * indicates significantly different from the corresponding SNX-482 lacking condition. E, Image of a spine and dendrite (top, left) and an example of fluorescence collected during line scan (top, right) indicated by the dashed yellow. Overlaid on the line scan fluorescent image is the action potential recorded at the soma (top) and the quantification of the ΔGbap/Gsat from the spine head (bottom). bottom, average ΔGbap/Gsat from the spine head measured in control (black), SNX-482 (green), oxo-m (red), and oxo-m+SNX-482 (orange) F, Summary of ΔGbap/Gsat amplitude for the four pharmacological conditions shown in D. * indicates significantly different from the corresponding SNX-482 lacking condition.
Figure 5
Figure 5. Activation of mAChRs inhibits repolarization-evoked SK currents
A, Voltage-step protocol (top) used to activate voltage-gated Ca channels, which leads to the accumulation of intracellular Ca and activation of Ca-activated K currents (bottom). Examples of currents measured in control conditions (black) and in the presence of oxo-m (red) before (thin lines) and after the application of apamin (thick lines) are shown. B, Summary of the time-courses of the effects of apamin on repolarization-evoked current amplitudes in control conditions (black) and in the presence of oxo-m (red). C, Averages currents evoked by repolarization (left) and summary of effects of apamin on current amplitudes in individual cells (right) in control conditions (black) and in oxo-m (red). Thick and thin traces depict currents in the baseline period and after application of apamin, respectively. D, Summary of apamin-sensitive repolarization-evoked charge transfer measured in control conditions (black) and in oxo-m (red).
Figure 6
Figure 6. Activation of mAChRs reduces the Ca-sensitivity of SK channels
A, Low-magnification gradient contrast image (gray) of the hippocampus slice showing the recording electrode with an overlay (purple) indicating the approximate area exposed to UV light. B, Timing of UV laser pulse (top), and examples of UV light-evoked currents (IUV) measured in control conditions (middle) and in oxo-m (bottom). Currents are shown for the baseline period (thick lines) and after application of apamin (thin traces). C, Summary of the time courses of the effects of apamin application on the peak of UV-evoked currents in control conditions (black, left) and in the presence of oxo-m (red, right). D, Average currents evoked by UV laser pulses of a variety of durations in control conditions (top) and in oxo-m (bottom). Colors correlate with increasing duration of UV uncaging pulse (red to purple; 2, 5, 7, 10, 15, 20 and 50 ms). E, Summary of the peak amplitudes of UV-evoked currents as a function of laser pulse duration measured in control conditions (black) and in the presence of oxo-m (red). The lines depict the best fits to the data using sigmoidal functions.
Figure 7
Figure 7. mAchRs dependent inhibition of SK occurs in the spine and requires casein kinase-2
A, Example of EPSPs evoked by Schaffer collateral stimulation before (thin lines) and after (thick lines) application of 100 nM apamin in control conditions (black) and in the presence of oxo-m (red). B, Summary of the effects of apamin application on EPSP amplitude (connected closed symbols) for each cell in control conditions (black) and in the presence of oxo-m (red). The average EPSP amplitude is also shown in each condition (open symbols). C, Summary of the relative amplitude of the EPSP after apamin application compared to baseline for control conditions (black) and in the presence of oxo-m (red). * indicates significantly different than 100%. D, uEPSPs (top) and Δ[Ca]spine (bottom) measured in the presence of TBB (left, black) and TBB + oxo-m (right, red). E, Summary of the uEPSP and ΔG/Gsat amplitudes for the conditions shown in D.

Comment in

References

    1. Allen D, Fakler B, Maylie J, Adelman JP. Organization and regulation of small conductance Ca2+-activated K+ channel multiprotein complexes. J Neurosci. 2007;27:2369–2376. - PMC - PubMed
    1. Andrásfalvy BK, Makara JK, Johnston D, Magee JC. Altered synaptic and non-synaptic properties of CA1 pyramidal neurons in Kv4.2 knockout mice. The Journal of Physiology. 2008;586:3881–3892. - PMC - PubMed
    1. Bildl W, Strassmaier T, Thurm H, Andersen J, Eble S, Oliver D, Knipper M, Mann M, Schulte U, Adelman JP, Fakler B. Protein kinase CK2 is coassembled with small conductance Ca(2+)-activated K+ channels and regulates channel gating. Neuron. 2004;43:847–858. - PubMed
    1. Bloodgood BL, Giessel AJ, Sabatini BL. Biphasic synaptic Ca influx arising from compartmentalized electrical signals in dendritic spines. PLoS Biol. 2009;7:e1000190. - PMC - PubMed
    1. Bloodgood BL, Sabatini BL. Nonlinear regulation of unitary synaptic signals by CaV(2.3) voltage-sensitive calcium channels located in dendritic spines. Neuron. 2007;53:249–260. - PubMed

Publication types

MeSH terms