. 2010 Dec 9;68(5):991-1001.
doi: 10.1016/j.neuron.2010.11.019.

Neural correlates of variations in event processing during learning in central nucleus of amygdala

Affiliations

Neural correlates of variations in event processing during learning in central nucleus of amygdala

Donna J Calu et al. Neuron. .

Abstract

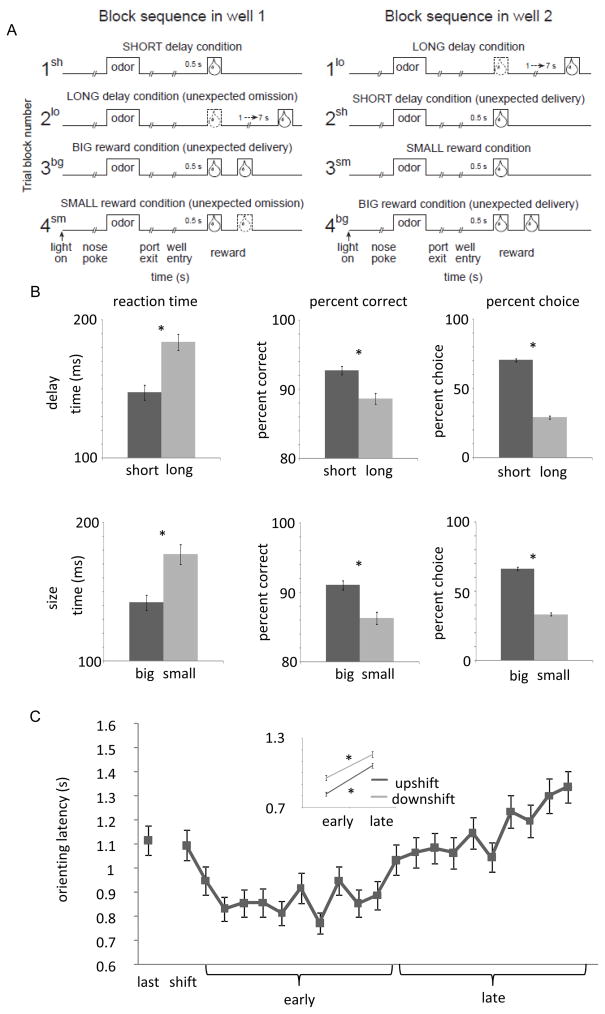
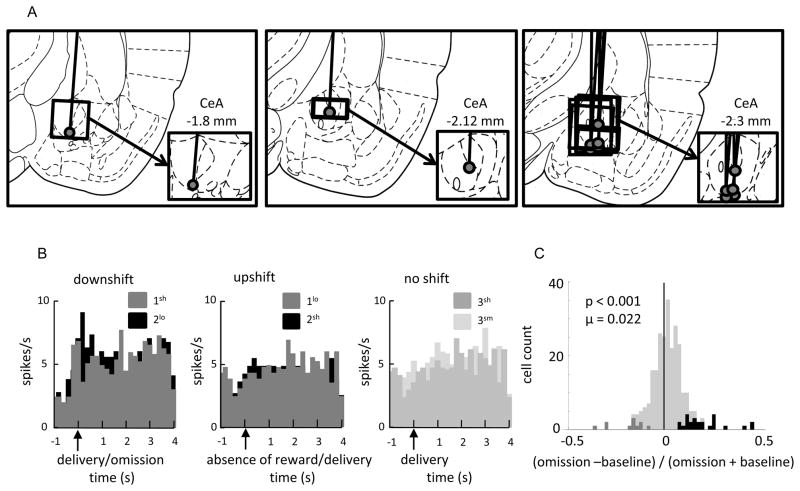
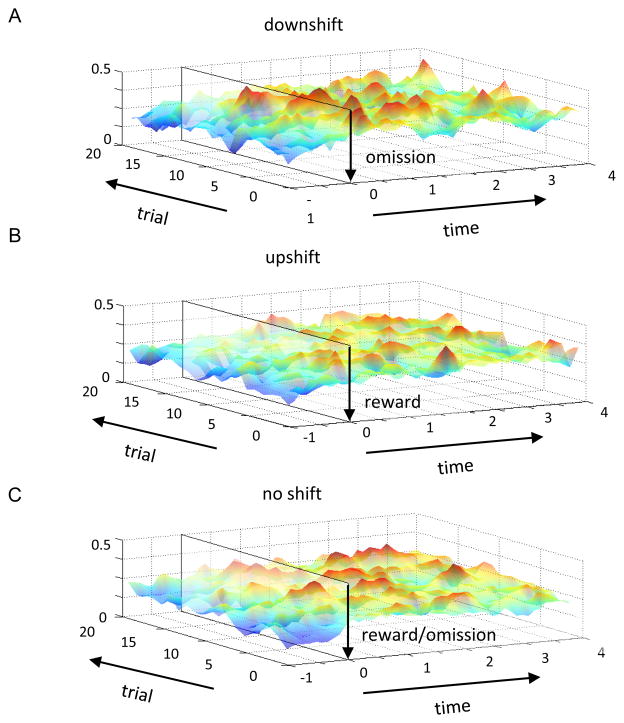
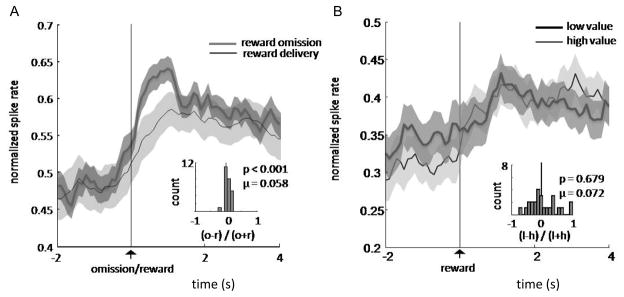
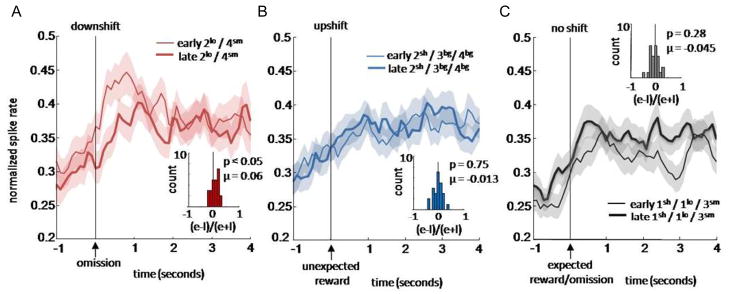
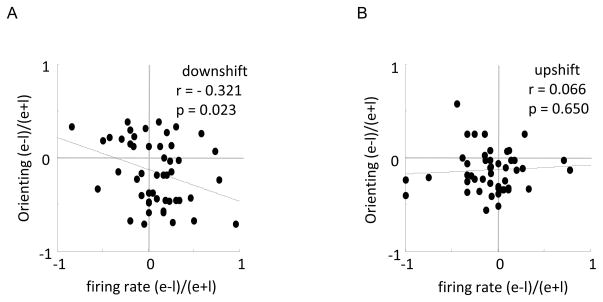
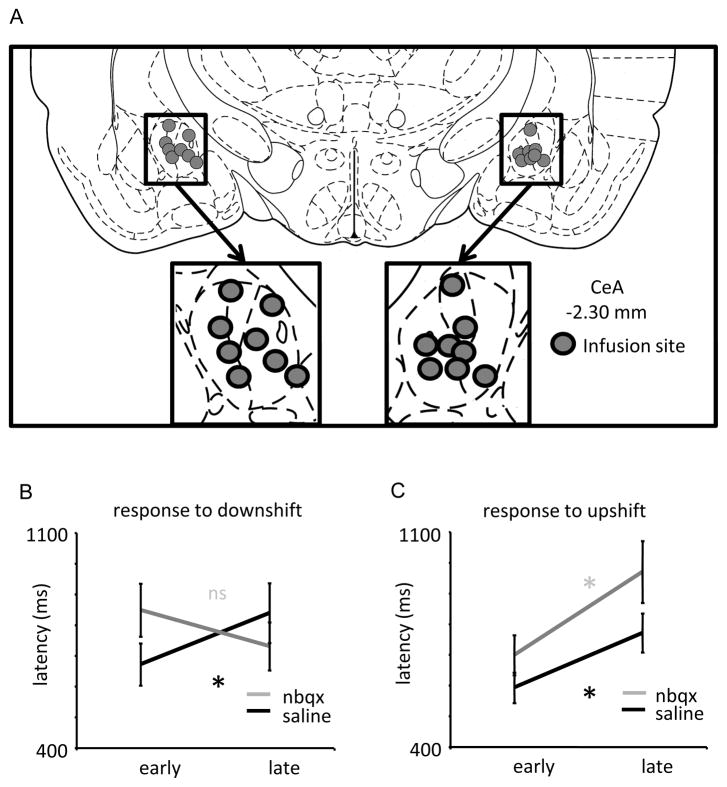
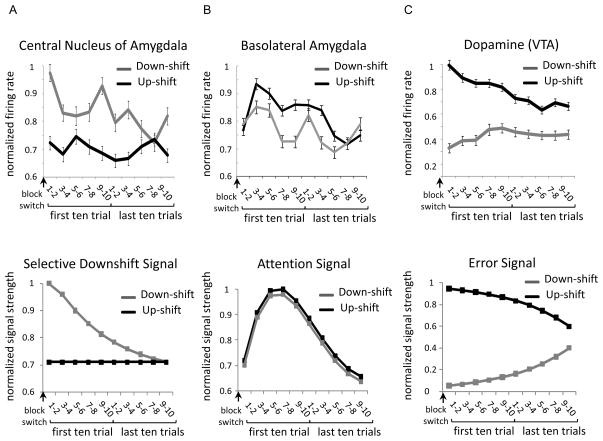
Attention or variations in event processing help drive learning. Lesion studies have implicated the central nucleus of the amygdala (CeA) in this process, particularly when expected rewards are omitted. However, lesion studies cannot specify how information processing in CeA supports such learning. To address these questions, we recorded CeA neurons in rats performing a task in which rewards were delivered or omitted unexpectedly. We found that activity in CeA neurons increased selectively at the time of omission and declined again with learning. Increased firing correlated with CeA-inactivation sensitive measures of attention. Notably CeA neurons did not fire to the cues or in response to unexpected rewards. These results indicate that CeA contributes to learning in response to reward omission due to a specific role in signaling actual omission rather than a more general involvement in signaling expectancies, errors, or reward value.


Figures

Figure 1
Figure 1
Behavioral performance during recording in CeA. A. Choice task block sequence. In the beginning of the session reward available at one well was presented at a short delay (500 ms) and the other well after a long delay (1–7 s) (counterbalanced across days). In block two, reward contingencies were switched, such that the well that was previously short delay becomes long, resulting in a surprising omission of expected reward at 500 ms (downshift, 2lo). Concurrently, a surprising reward delivery occurs at the well that was previously associated with long delay that is now designated as short delay (upshift, 2sh). In the third block delay to reward is held constant and reward size is manipulated. Importantly, while big reward (one bolus at 500 ms and another at 1 s) is surprisingly better than delayed reward (one bolus at 1–7 s) (upshift, 3bg), small reward (one bolus at 500 ms) is identical to reward delivered at a short delay (one bolus at 500 ms; no shift). In the fourth block the size contingencies are switched, such that small reward becomes big (upshift, 4bg) and big becomes small (downshift, 4sm). B. Behavior during choice task performance in recording sessions. (Top) Impact of delay length on reaction time (left) and percent correct (center) during forced trials, and percent choice (right) during free choice trials. (Bottom) Impact of reward size on reaction time (left) and percent correct (center) during forced trials, and percent choice (right) during free choice trials. C. Impact of surprising value shifts (2sh/lo, 3bg/sm, 4bg/sm)) on orienting latency during recording sessions. ‘Last’ indicates the last trial of the previous block. ‘Shift’ indicates the first trial in a block just before the rats have experienced a value shift. Inset shows change in orienting latencies across shift blocks as rats learn about upshifts and downshifts in reward value. Error bars represent standard error of the mean.
Figure 2
Figure 2
Effect of reward omission on neural activity in CeA. A. Location of recording electrodes. Gray dots represent final electrode placement, boxes represent approximate extent of recording sites, and black lines indicate center of electrode track. Plates adapted from the atlases of Paxinos and Watson (2009). B. Activity from a single CeA omission responsive neuron to downshift (left: activity from immediate reward block (1sh) and delayed reward block (2lo) aligned on reward delivery or omission respectively; center: activity from delayed reward block (1lo) and immediate reward block (2sh) aligned on when immediate reward is absent (1lo) or present (2sh) respectively; right: when no shift in reward value occurs (activity from delayed reward block (2sh) to small size block (3sm) aligned on reward delivery). C. Index of CeA neural activity to reward omission over baseline. Distribution of contrast scores for all neurons recorded in CeA comparing activity at the time of reward omission (2lo / 4sm) versus baseline activity. Black bars indicate single units that were defined as omission responsive (showed significantly greater firing to reward omission than to baseline). Darker gray bars indicate single units that were significantly suppressed during reward omission (count not different than would be expected by chance). Lighter gray bars indicate non-selective cells (omission vs. baseline) in CeA. For a waveform analysis of all 266 neurons recorded in CeA, see figure S3.
Figure 3
Figure 3
A. Population heat plot representing neural activity in CeA omission-responsive neurons at the time of reward omission (2lo / 4sm). Average activity is shown for the first and last 10 trials in these two blocks. Activity is shown, aligned on reward omission, which is 500 ms after well entry in the 2lo block and 1000 ms after well entry in the 4sm block. B. Population heat plot representing neural activity in CeA omission-responsive neurons at the time of reward delivery (2sh / 3bg / 4bg). Average activity is shown for the first and last 10 trials in these three blocks. Activity is shown, aligned on reward delivery, which is 500 ms after well entry in the 2sh block and 1000 ms after well entry in the 3bg and 4bg blocks. C. Population heat plot representing neural activity in CeA omission-responsive neurons during blocks in which there was no overt shift in reward value (1sh / 1lo / 3sm). Average activity is shown for the first and last 10 trials in these three blocks. Activity is shown, aligned on reward delivery or omission, which is 500 ms after well entry in the 1sh and 1lo blocks and 1000 ms after well entry in the 3sm block. For activity in the omission responsive population aligned on cue and reward delivery across the entire task, see figure S1A. For activity in a CeA reward responsive population, see figure S1B.
Figure 4
Figure 4
Effect of reward on activity in omission-responsive CeA neurons. A. Neural activity in CeA in response to reward delivery and omission. Impact of reward delivery or omission on activity in omission responsive population of neurons. Curves represent the normalized population firing rate (normalized to the maximum firing rate for each individual neuron) as a function of time across reward (1sh/lo, 2sh/lo, 3bg/sm, 4bg/sm) or omission blocks (2lo / 4sm). Activity aligned on reward omission or delivery. Inset shows the distribution of contrast scores for omission responsive neurons comparing activity at the time of reward omission versus activity at the time of reward delivery (o = omission, r = reward). B. Impact of reward value on activity in omission responsive population of neurons. Curves represent the normalized population response as a function of time after rats had learned (last five trials in a block) about high value (1sh, 2sh, 3bg, 4bg) and low value (1lo, 2lo, 3sm, 4sm) reward conditions. Activity aligned on reward delivery. Inset shows the distribution of contrast scores for activity after learning during delivery of low value rewards versus activity during delivery of high value rewards (l = low value, h = high value). Error bars represent standard error of the mean.
Figure 5
Figure 5
Effect of learning on omission and reward related activity in omission-responsive CeA neurons. A. Curves represent the normalized population firing rate (normalized to the maximum firing rate for each individual neuron) as a function of time during the first five and last five trials presented within downshift blocks (2lo and 4sm). Activity aligned on reward omission. Inset shows the distribution of contrast scores for activity e = early (first five trials) versus l = late (last five trials) for downshift condition (2lo and 4sm). B. Curves represent the normalized population firing rate as a function of time during the first five and last five trials presented within upshift blocks (2sh,3bg, and 4bg). Activity aligned on reward delivery. Inset shows the distribution of contrast scores for activity early versus late during upshift blocks (2sh,3bg, and 4bg). C. Curves represent the normalized population firing rate as a function of time during the first five and last five trials presented within non-shift blocks (1sh, 1lo and 3sm). Activity aligned on reward delivery for high value or omission for low value conditions. Inset shows the distribution of contrast scores for activity early versus late during blocks with no shift in reward value (1sh, 1lo and 3sm). Error bars represent standard error of the mean. For the effect of learning on omission and reward related activity in CeA reward responsive neurons, see figure S2.
Figure 6
Figure 6
Correlations between signaling of reward omission by CeA neurons and shifts in orienting behavior. Plots show normalized orienting latencies on trial after a shift as a function of normalized firing rate in omission responsive neurons on trial of a shift. A. Correlation between contrast indices for firing rate on trials of a downshift versus orienting latency on trials after a downshift. B. Correlation between contrast indices for firing rate on trials of an upshift versus orienting latency on trials after an upshift. e = early = first five trials, l = late = last five trials.
Figure 7
Figure 7
Effect of CeA inactivation on orienting behavior. A. Location of infusion sites. Gray dots represent the placement of needle tips inserted into bilateral cannulae targeting central nucleus for infusion of vehicle or inactivating agents. Plates adapted from the atlases of Paxinos and Watson (2009). B. Impact of surprising downshift in reward value on orienting latency. C. Impact of surprising upshift in reward value on orienting latency. Early = first three trials, late = last three trials after a downshift.
Figure 8
Figure 8
Time course of neural activity in CeA, ABL, and VTA dopamine neurons (DA) in response to changes in reward value that occur after a block switch. A. (Top) Average firing of CeA omission responsive neurons in response to reward upshifts (block; 2sh, 3bg, 4bg) and downshifts (gray; 2lo, 4sm) normalized to the maximum. (Bottom) Signal predicted by an adapted Pearce-Hall model which only permits signal increases selectively for downshifts in reward value, and does not integrate over trials (α = |λ-ΣV|, (λ-ΣV < 0)). Simulation of this predicted signal in response to unexpected reward delivery (black) and omission (gray). B. (Top) Average firing of ABL reward responsive neurons in response to reward upshifts (block; 2sh, 3bg, 4bg) and downshifts (gray; 2lo, 4sm) normalized to the maximum. (Bottom) Signal predicted by the Pearce-Hall model after unexpected reward delivery (black) and omission (gray) (α = γ(|λ-ΣV)| + (1-γ)α)C. (top) Average firing of VTA DA neurons in response to reward upshifts (block; 2sh, 3bg, 4bg) and downshifts (gray; 2lo, 4sm) normalized to the maximum. (Bottom) Signal predicted by the Rescorla-Wagner model after unexpected reward delivery (black) and omission (gray) α (λ-ΣV).Neural activity averaged in two trial blocks. Error bars represent standard error of the mean.

References

    1. Belova MA, Paton JJ, Morrison SE, Salzman CD. Expectation modulates neural responses to pleasant and aversive stimuli in primate amygdala. Neuron. 2007;55:970–984. - PMC - PubMed
    1. Bucci DJ, Holland PC, Gallagher M. Removal of cholinergic input to rat posterior parietal cortex disrupts incremental processing of conditioned stimuli. J Neurosci. 1998;18:8038–8046. - PMC - PubMed
    1. Bucci DJ, Macleod JE. Changes in neural activity associated with a surprising change in the predictive validity of a conditioned stimulus. Eur J Neurosci. 2007;26:2669–2676. - PubMed
    1. Chiba AA, Bucci DJ, Holland PC, Gallagher M. Basal forebrain cholinergic lesions disrupt increments but not decrements in conditioned stimulus processing. J Neurosci. 1995;15:7315–7322. - PMC - PubMed
    1. Han JS, Holland PC, Gallagher M. Disconnection of the amygdala central nucleus and substantia innominata/nucleus basalis disrupts increments in conditioned stimulus processing in rats. Behav Neurosci. 1999;113:143–151. - PubMed

Publication types

LinkOut - more resources