. 2010 Dec 14;19(6):845-57.
doi: 10.1016/j.devcel.2010.11.004.

mTORC2 regulates neutrophil chemotaxis in a cAMP- and RhoA-dependent fashion

Affiliations

mTORC2 regulates neutrophil chemotaxis in a cAMP- and RhoA-dependent fashion

Lunhua Liu et al. Dev Cell. .

Abstract

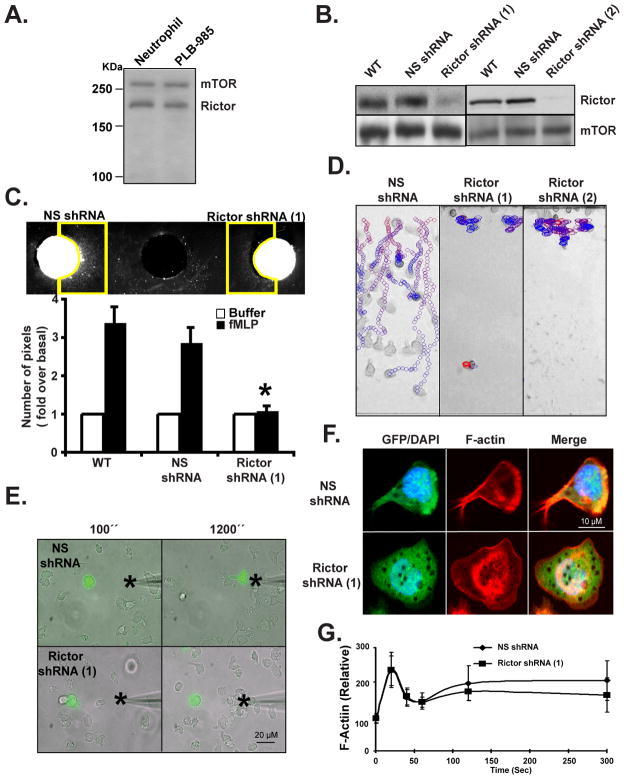
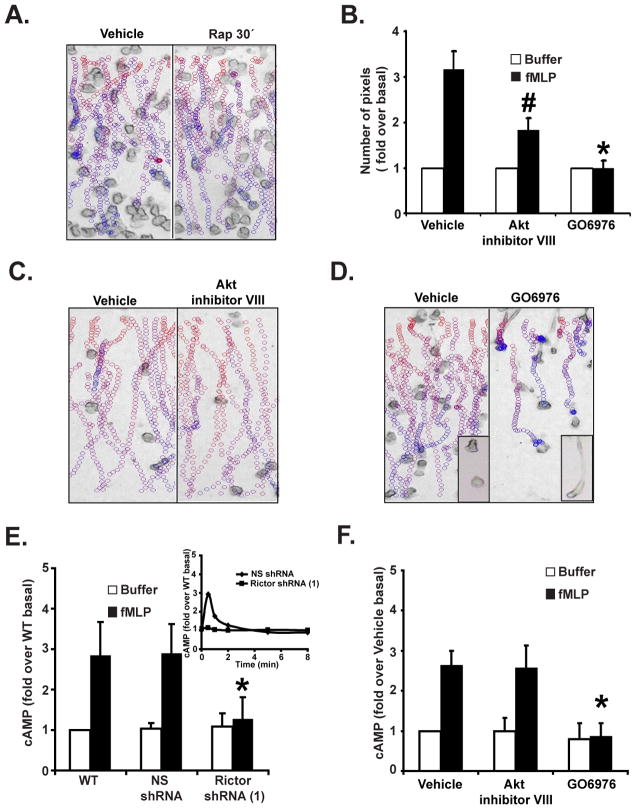
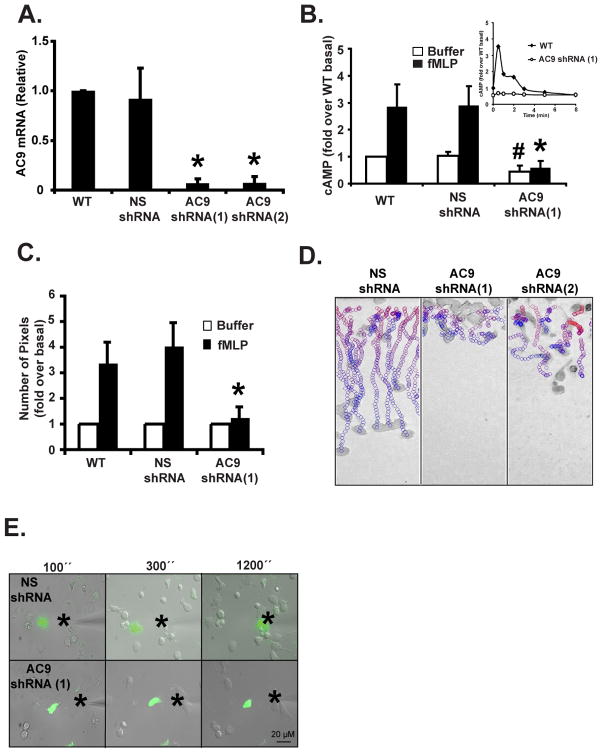
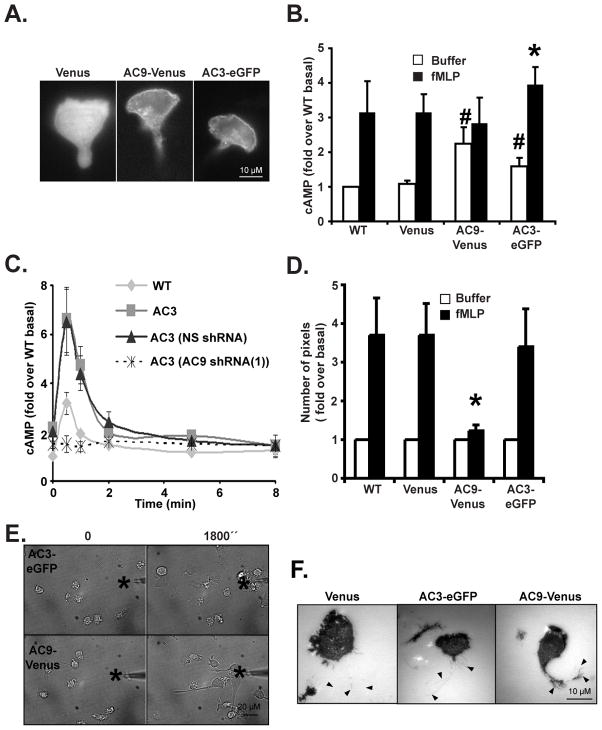
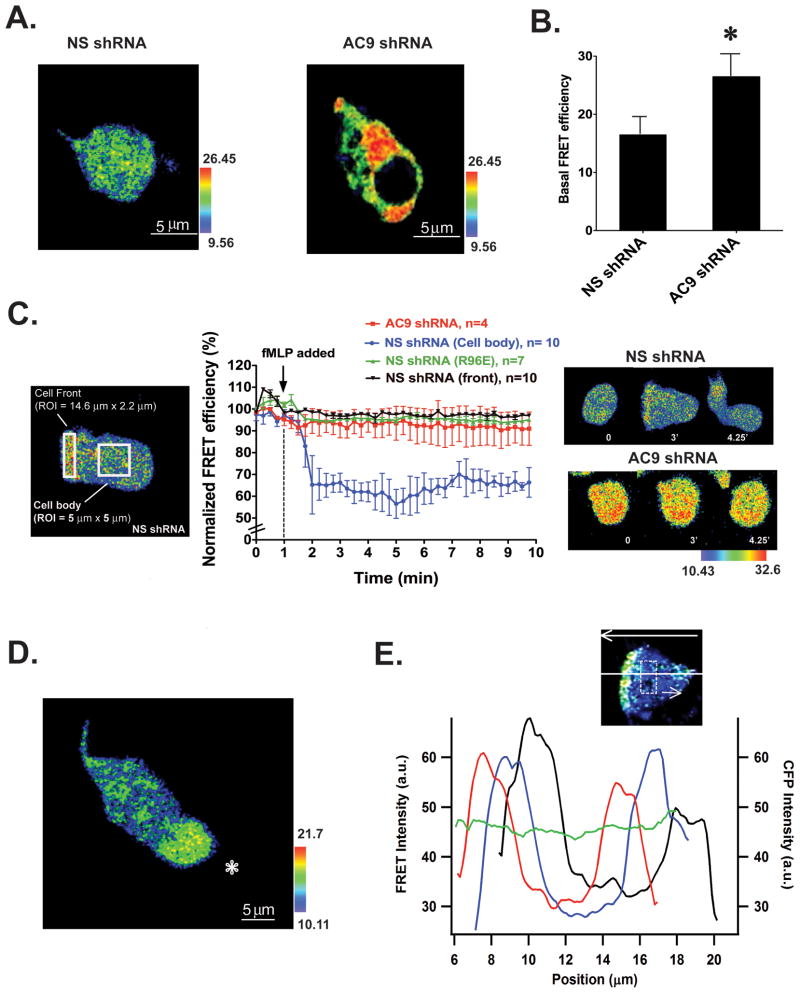
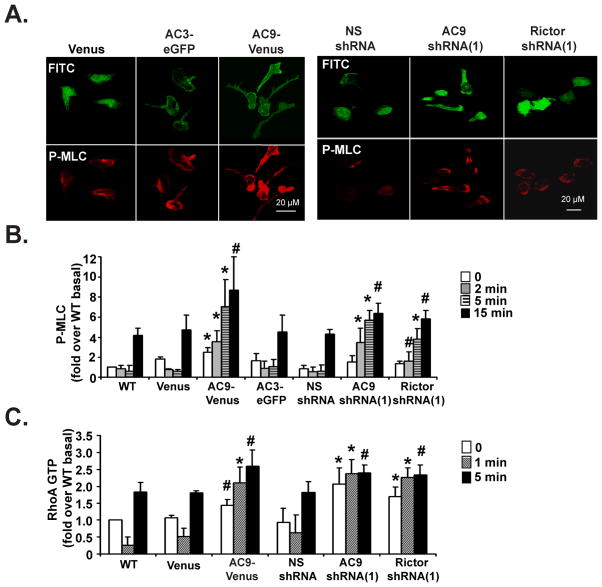
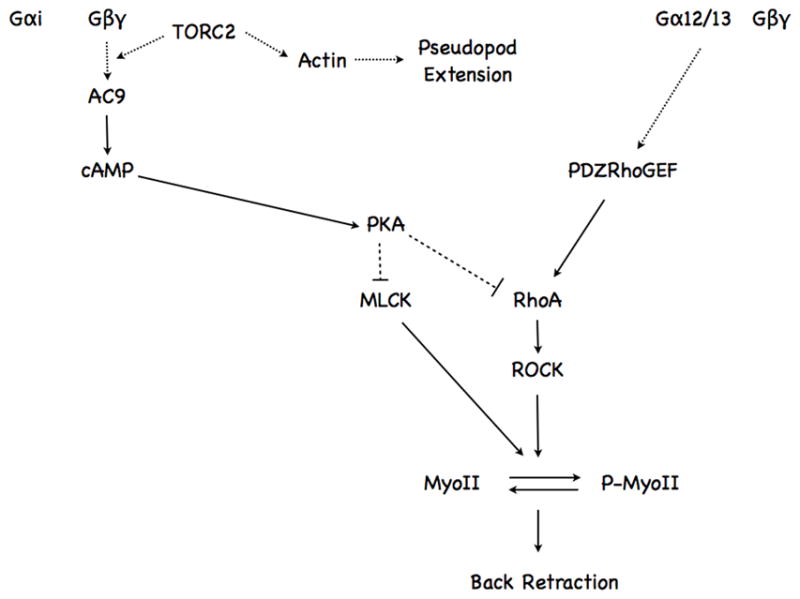
We studied the role of the target of rapamycin complex 2 (mTORC2) during neutrophil chemotaxis, a process that is mediated through the polarization of actin and myosin filament networks. We show that inhibition of mTORC2 activity, achieved via knock down (KD) of Rictor, severely inhibits neutrophil polarization and directed migration induced by chemoattractants, independently of Akt. Rictor KD also abolishes the ability of chemoattractants to induce cAMP production, a process mediated through the activation of the adenylyl cyclase 9 (AC9). Cells with either reduced or higher AC9 levels also exhibit specific and severe tail retraction defects that are mediated through RhoA. We further show that cAMP is excluded from extending pseudopods and remains restricted to the cell body of migrating neutrophils. We propose that the mTORC2-dependent regulation of MyoII occurs through a cAMP/RhoA-signaling axis, independently of actin reorganization during neutrophil chemotaxis.


Figures

Figure 1
Figure 1. Rictor KD inhibits neutrophil chemotaxis
A. Rictor and mTOR are expressed in human blood neutrophils and PLB-985 cells. Cells were lysed and subjected to Western analyses using antibodies specific for Rictor and mTOR. B. Rictor KD in PLB-985 cells. Cells were lysed and subjected to Western analyses using antibodies specific for Rictor, mTOR. Results are representative of three independent experiments. Also see Fig. S1A and S1B. C. Under-agarose chemotaxis assay of Rictor shRNA cells. Central well contains 500 nM fMLP. Quantification was performed as described in the Experimental Procedures. Results represent the average +/− SD of three independent experiments. * indicates p<0.01 compared to the fMLP-stimulated WT group. Also see Fig. S1C. D. EZ-Taxiscan chemotaxis towards fMLP of Rictor KD cells. The images show paths of individual cells migrating in a gradient of fMLP as circles (from red to blue with increasing time) overlaid onto the final frame. For clarity, only cells that moved in 10 consecutive frames are shown. However, all cells were included for quantification (see Fig. S3E). Data are representative of six independent experiments. Also see Movie S1. E. Chemotaxis of Rictor KD cells to a point source of fMLP. Images depicting differentiated cells migrating to a micropipette containing 1 μM fMLP were captured every 10 secs. The star represents the position of the tip of the micropipette. Overlay of bright field and fluorescent images are representative of three independent experiments are presented. Also see Movie S2. F. Rictor shRNA cells show uniform F-actin accumulation after fMLP stimulation. Differentiated cells were stimulated with a uniform concentration of fMLP (1 μM) for 10 min and fixed. F-actin was detected by rhodamine-phalloidin staining. Results are representative of three independent experiments. Also see Fig. 1D. G. Rictor shRNA cells show normal F-actin polymerization after fMLP stimulation. Differentiated cells were stimulated with a uniform concentration of fMLP (1 μM) and fixed at indicated time point. F-actin content was detected by rhodamine-phalloidin staining. Results represent the average +/− SD of three independent experiments. Also see Fig. 1E.
Figure 2
Figure 2. Rictor regulates chemotaxis and chemoattractant-induced cAMP accumulation in an Akt-independent and PKC-dependent fashion
A. EZ-Taxiscan chemotaxis towards fMLP of Rapamycin-treated human blood neutrophils. Neutrophils were treated with or without 100 nM Rapamycin for 30 min. Data are representative of three independent experiments. See legend Fig. 1D for details. Paths for 24 hrs treatment is not shown because no significant movement could be detected. Also see Fig. S2A, S2B, S2D, and Movie S3. B. Under-agarose chemotaxis assay of Akt or cPKC-inhibited human blood neutrophils. Neutrophils were treated with or 10 μM Akt inhibitor VIII or 10 μM cPKC inhibitor GO6976 for 30 min. Central well contains 500 nM fMLP. Quantification was performed as described in Experimental Procedures. Results represent the average +/− SD of three independent experiments. # indicates p<0.05 compared to the vehicle fMLP group. C. EZ-Taxiscan chemotaxis towards fMLP of Akt-inhibited human blood neutrophils. Neutrophils were treated with or without 10 μM Akt inhibitor VIII for 30 min. Data are representative of five independent experiments. See legend Fig. 1D for details. Also see Fig. S2D and Movie S3. D. EZ-Taxiscan chemotaxis towards fMLP of cPKC-inhibited human blood neutrophils. Neutrophils were treated with or without 10 μM GO6976 for 30 min. Insert shows a higher magnification image of the cells. Data are representative of five independent experiments. See legend Fig. 1D for details. Also see Fig. S2D and Movie S3. E. Rictor KD inhibits fMLP-induced cAMP production. Differentiated cells were stimulated with 1 μM fMLP for 30 secs and intracellular cAMP levels were measured before and after chemoattractant addition. The inset shows the time-course measurement of intracellular cAMP levels. SEM values are presented from six independent experiments. * indicates p<0.01 compared to the fMLP-stimulated NS shRNA group. Also see Fig. S2E. F. cPKC but not Akt regulates fMLP-induced cAMP production. Human blood neutrophils were treated with 10 μM Akt inhibitor VIII or 10 μM cPKC inhibitor GO6976 for 30 min. Intracellular cAMP levels were measured before and after chemoattractant addition. Results represent the average +/− SD of three independent experiments. * indicates p<0.01 compared to the fMLP-stimulated vehicle group. Also see Fig. S2F.
Figure 3
Figure 3. Chemoattractant-induced cAMP production is mediated by AC9 and is required for neutrophil chemotaxis
A. KD of AC9 expression in PLB-985 cells. Total RNA from cells was extracted and AC9 mRNA level were measured by Real-time RT PCR. Results represent the average +/− SD of three independent experiments. Also see Fig. S3A. B. KD of AC9 expression inhibits chemoattractant-induced cAMP production. Intracellular cAMP levels were measured before and 30 secs after a 1 μM fMLP stimulation in differentiated cells. The inset shows the time-course measurement of intracellular cAMP levels. SEM values are presented from six independent experiments. # indicates p<0.05 compared to the buffer NS shRNA group; * indicates p<0.01 compared to the fMLP-stimulated NS shRNA group. Also see Fig. S3B & S3C. C. Under-agarose chemotaxis assay of AC9 shRNA(1) cells. Central well contains 500 nM fMLP. Quantification was performed as described in Experimental Procedures. Results represent the average +/− SD of four independent experiments. * indicates p<0.01 compared to the fMLP-stimulated NS shRNA group. Also see Fig. S3D. D. EZ-Taxiscan chemotaxis towards fMLP of AC9 KD cells. Data are representative of six independent experiments. See legend Fig. 1D for details. Also see Fig. S3E and Movie S1. E. Chemotaxis of AC9 shRNA(1) cells to a point source of fMLP. Images depicting differentiated cells migrating to a micropipette containing 1 μM fMLP. The star represents the position of the tip of the micropipette. Overlay of bright field and fluorescent images are representative of three independent experiments are presented. Also see Movie S4.
Figure 4
Figure 4. Exogenous expression of AC9 inhibits chemoattractant-induced cAMP production and chemotaxis
A. Fluorescent images depicting the sub-cellular distribution of Venus, AC3-eGFP or AC9-Venus in differentiated and migrating cells. B. Over-expression of AC9 results in higher basal cAMP levels and inhibits chemoattractant-induced cAMP production. Differentiated cells were stimulated with 1 μM fMLP for 30 secs and intracellular cAMP levels were measured before and after chemoattractant addition. SEM values are presented from six independent experiments. # indicates p<0.05 compared to the buffer Venus group; * indicates p<0.01 compared to the fMLP-stimulated Venus group. C. KD of AC9 inhibits chemoattractant-induced cAMP production in AC3-eGFP over-expressing cells. Differentiated cells were stimulated with 1 μM fMLP and intracellular cAMP levels were measured at indicated time point. The average +/− SD from three independent experiments. Also see Fig. S4C. D. Under-agarose chemotaxis assay of AC9-Venus and AC3-eGFP cells. Central well contains 500 nM fMLP. Quantification was performed as described in Experimental Procedures. Results represent the averaged +/− SD of three independent experiments. * indicates p<0.01 compared to the fMLP-stimulated Venus group. Also see Fig. S4D. E. AC9-Venus cells exhibit long tail during chemotaxis. Images depicting differentiated cells migrating to a micropipette containing 1 μM fMLP were captured every 10 secs. The star represents the position of the tip of the micropipette. Bright field images are representative of three independent experiments are presented. See also Movie S5. F. AC9-Venus cells have stronger tail attachment. Differentiated cells were stimulated with 1 μM fMLP and IRM images were recorded every 10 secs. Black arrow heads represent the location of the tail from the phase images. Representative images are presented. Also see Movie S6.
Figure 5
Figure 5. cAMP is excluded from extending pseudopods in randomly migrating and chemotaxing neutrophils
A. Basal FRET efficiency images represented in pseudo-color for differentiated NS shRNA and AC9 shRNA. Also see Fig. S5A. At low cAMP levels observed in AC9 KD cells, the probe remains in a close state and the FRET response is maximal. In the presence of cAMP, a conformational change occurs and the FRET response is lost. B. Average basal FRET efficiency in differentiated NS shRNA and AC9 shRNA cells, n=8. * indicates p<0.01 compared to NS shRNA cells. C. Time course of FRET efficiency following a uniform stimulation with 1 μM fMLP in NS shRNA and AC9 shRNA cells expressing the WT FRET sensor and in NS shRNA cells expressing a mutated FRET sensor (R96E). The left panel shows the area where the FRET efficiency was measured. The right panel depicts FRET efficiency images at different time points for NS shRNA and AC9 shRNA cells expressing the WT FRET sensor. Also see Fig. S5B & Movie S7. D. Differentiated NS shRNA cells were exposed to a micropipette containing 1 μM fMLP. The position of the micropipette is indicated by the star. The pseudocolor image was taken from a representative experiment and represents FRET efficiency. Also see Movie S7. E. Graph depicting FRET intensities as a function of the position along the long axis of the cell for three consecutive time points acquired at 15 secs interval (depicted in red, blue and black lines). Each point is an average over a smoothing region 5.6 μm across the cell width and 2.1 μm along the long axis of the cell (dashed square indicates the size of the sliding smoothing region). The top arrow indicates the direction of cell migration. The green line depicts the intensity of CFP fluorescence across the cell.
Figure 6
Figure 6. AC9 regulates RhoA activity and phosphorylated Myosin II levels
A. AC9-Venus and AC9 KD cells exhibit higher P-MLC staining. Differentiated cells were uniformly stimulated with 1 μM fMLP for 15 min and fixed. Representative dual images are presented. B. AC9-Venus, AC9 shRNA, and Rictor shRNA cells show higher P-MLC levels. Differentiated cells were plated on fibronectin-coated plates for 10 min and uniformly stimulated with 1 μM fMLP. At specific time points, samples were subjected to Western analyses using an anti-P-MLC antibody. Quantification of three experiments is presented as the amount of P-MLC after fMLP stimulation relative to that of unstimulated cells (mean ± SD). The amount of P-MLC at each point was standardized by dividing its value with the value of total MLC of the same time point. Also see Fig. S6A. * indicates p<0.01 and # indicates p<0.05 compared to either Venus or NS shRNA cells. C. AC9-Venus, AC9 shRNA, and Rictor shRNA cells show defects in RhoA-GTP activation. Differentiated cells were treated as in panel B. Quantification of three experiments is presented as the amount of RhoA-GTP after fMLP stimulation relative to that of WT unstimulated cells (mean ± SD). The amount of RhoA-GTP at each point was standardized by dividing its value with the value of total RhoA of the same time point. Also see Fig. S6C. * indicates p<0.01 and # indicates p<0.05 compared to either Venus or NS shRNA cells.
Figure 7
Figure 7. Schematic diagram depicting how chemoattractant-mediated increases in intracellular cAMP levels regulate neutrophil back retraction
See text for details.

Comment in

  • "TORCing" neutrophil chemotaxis.
    Charest PG, Firtel RA. Charest PG, et al. Dev Cell. 2010 Dec 14;19(6):795-6. doi: 10.1016/j.devcel.2010.11.017. Dev Cell. 2010. PMID: 21145496 Free PMC article.
  • Cell migration: MTORC2 brings up the rear.
    David R. David R. Nat Rev Mol Cell Biol. 2011 Feb;12(2):74. doi: 10.1038/nrm3046. Epub 2011 Jan 12. Nat Rev Mol Cell Biol. 2011. PMID: 21224887 No abstract available.

References

    1. Alessi DR, Deak M, Casamayor A, Caudwell FB, Morrice N, Norman DG, Gaffney P, Reese CB, MacDougall CN, Harbison D, et al. 3-Phosphoinositide-dependent protein kinase-1 (PDK1): structural and functional homology with the Drosophila DSTPK61 kinase. Curr Biol. 1997;7:776–789. - PubMed
    1. Ali H, Sozzani S, Fisher I, Barr AJ, Richardson RM, Haribabu B, Snyderman R. Differential regulation of formyl peptide and platelet-activating factor receptors. Role of phospholipase Cbeta3 phosphorylation by protein kinase A. J Biol Chem. 1998;273:11012–11016. - PubMed
    1. Amano M, Ito M, Kimura K, Fukata Y, Chihara K, Nakano T, Matsuura Y, Kaibuchi K. Phosphorylation and activation of myosin by Rho-associated kinase (Rho-kinase) J Biol Chem. 1996;271:20246–20249. - PubMed
    1. Bagorda A, Das S, Rericha EC, Chen D, Davidson J, Parent CA. Real-time measurements of cAMP production in live Dictyostelium cells. J Cell Sci. 2009;122:3907–3914. - PMC - PubMed
    1. Bagorda A, Mihaylov VA, Parent CA. Chemotaxis: moving forward and holding on to the past. Thromb Haemost. 2006;95:12–21. - PubMed

Publication types

MeSH terms