. 2011 Jan 7;1218(1):64-73.
doi: 10.1016/j.chroma.2010.10.096. Epub 2010 Oct 31.

Peak capacity optimization in comprehensive two dimensional liquid chromatography: a practical approach

Affiliations

Peak capacity optimization in comprehensive two dimensional liquid chromatography: a practical approach

Haiwei Gu et al. J Chromatogr A. .

Abstract

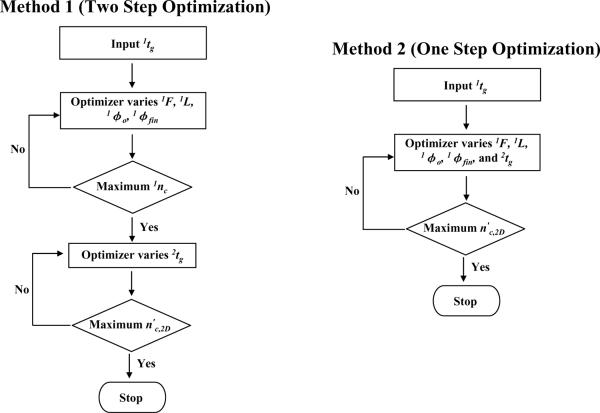
In this work we develop a practical approach to optimization in comprehensive two dimensional liquid chromatography (LC x LC) which incorporates the important under-sampling correction and is based on the previously developed gradient implementation of the Poppe approach to optimizing peak capacity. The Poppe method allows the determination of the column length, flow rate as well as initial and final eluent compositions that maximize the peak capacity at a given gradient time. It was assumed that gradient elution is applied in both dimensions and that various practical constraints are imposed on both the initial and final mobile phase composition in the first dimension separation. It was convenient to consider four different classes of solute sets differing in their retention properties. The major finding of this study is that the under-sampling effect is very important and causes some unexpected results including the important counter-intuitive observation that under certain conditions the optimum effective LC x LC peak capacity is obtained when the first dimension is deliberately run under sub-optimal conditions. In addition, we found that the optimum sampling rate in this study is rather slower than reported in previous studies and that it increases with longer first dimension gradient times.


Figures

Figure 1
Figure 1
Flow diagrams for method 1 (two step optimization) and method 2 (one step optimization) optimization. In method 1, the same conditions are used in the LC×LC system and then the effective LC×LC peak capacity of this system is further maximized by varying 2tg. In method 2, the optimized first dimension conditions may not be the same as those found in method 1. See the Theory and Computational Methods section for additional details. 1nc is computed from Eq. (3) and nc,2D is from Eq. (12) or (13).
Figure 2
Figure 2
1DLC gradient peak capacity gradient Poppe plots for the four mixtures (see Table 1) on the column. Conditions (see Table 2 for details): Pmax, 400 bar; T, 40 °C; ηmax, 0.69 cP; maximum Dm, 1.42×10⁻⁵ cm2/s. Coefficients of the reduced van Deemter equation (A, 1.04; B, 15.98; C, 0.033) were measured on a 50mm × 2.1mm 3.5 μ m Zorbax SB-C18 column using heptanophenone in 40% acetonitrile (v/v) at 40 °C (k = 20). Mixture A dark blue line (dash-dot); Mixture B pink line (long dashed); Mixture C orange line (short dashed); Mixture D blue line (dot).. See Table 1 for definition of solute mixtures.
Figure 3
Figure 3
Effective LC×LC peak capacity vs. second dimension gradient time. a). Mixture A in case 1 by either method 1 or method 2 optimization; b). Mixture B in case 1 by either method 1 or method 2 optimization; c). Mixture C in case 2 by method 1 optimization; d). Mixture C in case 2 by method 2 optimization; e). Mixture D in case 3 by method 1 optimization; f). Mixture D in case 3 by method 2 optimization. Dark blue diamonds: 1tg=5 min; pink squares: 1tg=12 min; orange triangles: 1tg=24 min; blue circles: 1tg=49 min. See the definitions of cases and mixtures in Table 1.
Figure 4
Figure 4
Peak capacity from the optimized first dimension and the effective LC×LC peak capacity from the optimized LC×LC system (method 2 optimization) vs first dimension gradient time. a). mixture A in case 1; b). mixture B in case 1; c). mixture C in case 2; d). mixture D in case 3. Dark blue diamonds: the peak capacity from the optimized first dimension; pink squares: the effective LC×LC peak capacity from the optimized LC×LC system. See the definitions of cases and mixtures in Table 1.

References

    1. Stoll DR, Li X, Wang X, Porter SEG, Rutan SC, Carr PW. J. Chromatogr., A. 2007;1168:3. - PMC - PubMed
    1. Francois I, Sandra K, Sandra P. Anal. Chim. Acta. 2009;641:14. - PubMed
    1. Dunn WB, Ellis DI. Trac-Trend Anal. Chem. 2005;24:285.
    1. Stoll DR. Anal. Bioanal. Chem. 2010;397:979. - PubMed
    1. Giddings JC. Anal. Chem. 1984;56:1258A. - PubMed

Publication types

LinkOut - more resources