. 2011 Feb;1813(2):346-57.
doi: 10.1016/j.bbamcr.2010.11.020. Epub 2010 Dec 9.

Modulation of α(2C) adrenergic receptor temperature-sensitive trafficking by HSP90

Affiliations

Modulation of α(2C) adrenergic receptor temperature-sensitive trafficking by HSP90

Catalin M Filipeanu et al. Biochim Biophys Acta. 2011 Feb.

Abstract

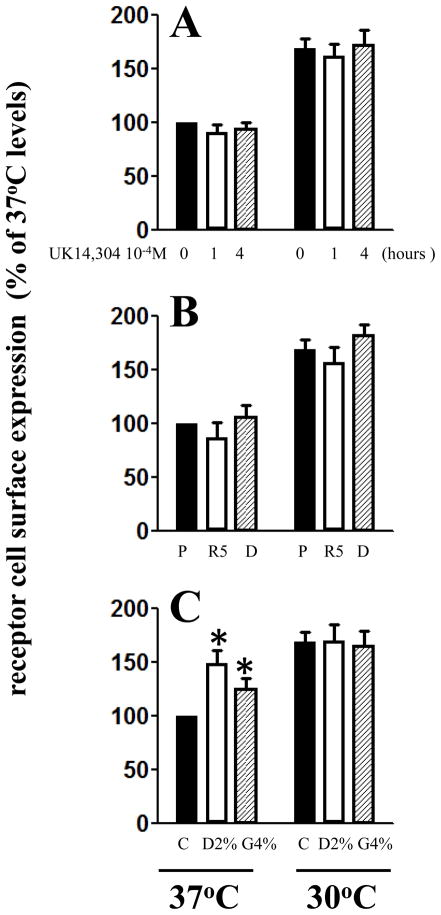
Decreasing the temperature to 30°C is accompanied by significant enhancement of α(2C)-AR plasma membrane levels in several cell lines with fibroblast phenotype, as demonstrated by radioligand binding in intact cells. No changes were observed on the effects of low-temperature after blocking receptor internalization in α(2C)-AR transfected HEK293T cells. In contrast, two pharmacological chaperones, dimethyl sulfoxide and glycerol, increased the cell surface receptor levels at 37°C, but not at 30°C. Further, at 37°C α(2C)-AR is co-localized with endoplasmic reticulum markers, but not with the lysosomal markers. Treatment with three distinct HSP90 inhibitors, radicicol, macbecin and 17-DMAG significantly enhanced α(2C)-AR cell surface levels at 37°C, but these inhibitors had no effect at 30°C. Similar results were obtained after decreasing the HSP90 cellular levels using specific siRNA. Co-immunoprecipitation experiments demonstrated that α(2C)-AR interacts with HSP90 and this interaction is decreased at 30°C. The contractile response to endogenous α(2C)-AR stimulation in rat tail artery was also enhanced at reduced temperature. Similar to HEK293T cells, HSP90 inhibition increased the α(2C)-AR contractile effects only at 37°C. Moreover, exposure to low-temperature of vascular smooth muscle cells from rat tail artery decreased the cellular levels of HSP90, but did not change HSP70 levels. These data demonstrate that exposure to low-temperature augments the α(2C)-AR transport to the plasma membrane by releasing the inhibitory activity of HSP90 on the receptor traffic, findings which may have clinical relevance for the diagnostic and treatment of Raynaud Phenomenon.


Figures

Figure 1
Figure 1. The effects of low-temperature on the plasma membrane expression of human α2C-AR
A. The six cell lines indicated were transfected with α2C-AR (3μg/10cm2 plate) and after 6 hours were trypsinized and plated on 12-well plates at ~80% confluence. Twelve hours later the medium was changed to DMEM without FBS and after another 12 h the cells were exposed to 30°C for the time periods indicated on the x-axis. The α2C-AR cell surface levels were determined by [3H]-RX821002 binding in intact cells as described in Material and Methods; mean ± SD, n=4–12 for each point B. Time-dependent increase in α2C-AR plasma membrane levels in transfected HEK293T exposed at 30°C. The cells were transfected as in A, exposed for 18 h at the temperatures indicated on the x-axis and the cell surface levels were determined in intact cells; mean ± SD, n=4–12 in each case. C. The plasma membrane levels of α2C-AR at 37°C (black symbols) and at 30°C (white symbols) determined in intact HEK293T cells. The cells were incubated at 4°C for 4 h with the indicated concentarations of [3H]-RX821002 and the bound radioactivity was determined by liquid scintillation spectrometry; n=4–12 for each point, from four different transfections. D. Same as in E, but for α2B-AR transfected HEK293T cells; n=4–12 for each point. E. Total levels of α2C-AR (left columns) and α2B-AR (right columns) at 37°C (black columns) and at 30°C (white columns) were determined by flow cytometry measuring GFP fluorescence; data are presented as mean ± SD from the values obtained at 37°C, n=3 from three independent transfections. F. The plasma membrane levels of α2C-AR wild type (wt) and α2C322-325del-AR isoform (GAGP) at 37°C (black bars) and at 30°C (white bars) determined in intact HEK293T cells; mean ± SD, n=12 in each case from four different transfections. G. The plasma membrane levels of untagged, GFP-tagged and HA-tagged α2C-AR in HEK293T cells at 37°C (black bars) and at 30°C (white bars); mean ± SD, n=4–12 in each case
Figure 2
Figure 2. The roles of receptor internalization and chemical chaperones in the temperature-dependent α2C-AR trafficking
A. The cells were processed as above and α2C-AR transfected HEK293T cells maintained at 37°C or at 30°C for 18 h prior determinations were incubated with UK14304 (10−4M) for 1 (white bars) and 4 h (hatched bars) at each temperature and the receptor plasma membrane levels were determined in intact cells by [3H]-RX821002 binding. mean ± SD, n=6–10 in each case. B. Same as in A, but HEK293T cells were co-transfected with α2C-AR (0.5 μg) and 3 μg of pcDNA 3.1+ (P, black bars), Rab5N135I (R5, white bars ) or Dynamin I K44A (D, hatched bars) and the receptor cell surface levels were determined in similar manner, mean ± SD, n=4–8 from 2 different transfections. C. The effects of DMSO (2%, white bars) and glycerol (4% hatched bars) on the α2C-AR plasma membrane levels at 37°C and at 30°C; n=8–12 in each case from four different transfections, * - p < 0.05.
Figure 3
Figure 3. The subcellular localization of GFP-tagged α2C-AR at 37°C (left column) and at 30°C (right column)
HEK293T were transfected with 1 μg per 10 cm2 plate with GFP-tagged receptors and processed in the same way as for radio-ligand binding. The individual organelles were identified as follows: A. The endoplasmic reticulum was visualized by co-transfection with the specific marker pDsRed2-ER. B. The plasma membrane was stained using Na+/K+ ATP-ase antibody as described in Material and Methods. C. Cis-Golgi was labeled after incubation with GM130 antibody. D. The lysosomal compartment was visualized by co-transfection with DsRed2-Rab7. The cells were fixed with 4% paraformaldehyde–4% sucrose mixture and the distribution of α2C-AR was analyzed by fluorescence microscopy. Blue: DNA staining by 4,6-diamidino-2-phenylindole (nuclear), green: GFP-α2C-AR, red: specific organelle indicated in the figure, yellow: co-localization of the receptor with the respective organelle marker. The images are representative from at least six different coverslips, obtained from three independent transfections..
Figure 4
Figure 4. The effects of manipulations in HSP90 activity on the temperature-dependent α2C-AR plasma membrane expression
A. HEK293T cells were transfected with α2C-AR or with α2B-AR (right columns, 3 μg/10cm2 plate left columns) and subsequently plated on 12-well plates as described in Figure 1. Six hours after FBS was withdrawn the cells were incubated for 1 h with either vehicle (V), macbecin (M, 5 μM), 17-DMAG (17, 0.5 μM) or radicicol (R, 10 μM) and subsequently exposed to 37°C or to 30°C for the next 18h in the presence of the HSP90 inhibitors. The receptor plasma membrane levels were determined in intact cells as described in Material and Methods. Mean ± SD from 4–6 independent transfections. * - indicate p<0.05 compared to the vehicle. B. Dose-dependent effects of 17-DMAG on the wild-type α2C-AR (triangles) and α2C322-325del-AR (squares) at 37°C (black symbols) or at 30°C (white symbols). HEK293T were transfected as in A, and exposed to increased concentrations of 17-DMAG indicated on the x-axis; mean ± SD with n=4–8 for each point from four different transfections. C. Left panel demonstrate the reduction of HSP90 expression levels in HEK293T cells by siRNA targeting. HEK293T cells were first transiently transfected with α2C-AR (3 μg/10cm2 plate). Six hours later the cells were trypsinized and replated on 12-well plates and transfected with siRNA following the manufacturer instructions (Ambion). After 12 hours the medium was changed to DMEM without FBS and then processed as for radio-ligand binding experiments. The result is representative from three independent transfections. Right panel: quantitative data expressed as percentage of the HSP90 levels in control cells transfected with control siRNA at 37°C. mean ± SD from three independent transfections. D. The effects of HSP90 downregulation using siRNA on the α2C-AR plasma membrane levels at 37°C and at 30°C determined by [3H]RX821002 binding in intact cells in the same transfections as used for the western blot experiments presented in C; mean ± SD, n=9 from three independent transfection. * - indicate p<0.05 compared to the levels in control siRNA transfected cells at 37°C.
Figure 5
Figure 5. Interactions between α2C-AR and HSP90 in HEK293T cells
A. HEK293T cells were transfected with empty vector pcDNA 3.1, or HA-tagged α2C-AR and 3xHA tagged α2B-AR (3 μg/10cm2 plate each) and 6 hours later the medium was changed to DMEM without FBS, followed by incubation at 30°C or at 37°C for the subsequent 18 h. Some plates were treated with macbecin (5 μM). Subsequently, the cells were solubilized and immunoprecipitated with HA antibody as described under Material and Methods. The HA immunoprecipitates (20 μg/lane) were separated by 10 % SDS-Page and the HSP90 levels were revealed by Western-blotting. The experiment shown is representative from three independent transfections. Similar results were obtained in case of α2C-AR using GFP-tagged receptor and GFP antibody. B. Quantification of the data presented in A. mean ± SD, n=3, *-indicate statistical significant differences compared with control cells (p < 0.05).
Figure 6
Figure 6. The effects of GRP94 overexpression and proteasomal inhibition on the α2C-AR temperature-sensitive trafficking
A. HEK293T cells were co-transfected with α2C-AR and pcDNA 3.1 (left columns) or GRP94 (right columns). The cell surface α2C-AR levels in cells maintained at 37°C (black columns) or at 30°C for 18 h (white columns) were determined in intact cells as above. mean ± SD, n=9 from three independent transfections. B. α2C-AR tranfected HEK293T cells were incubated with DMSO (vehicle, 0.1%), MG132 (10 μM) or lactacystin (5μM) and subsequently exposed to 30°C for 18h or maintained at 37°C. The α2C-AR plasma membrane levels were determined in intact cells. n=9 from three independent transfections.
Figure 7
Figure 7. The effects of low-temperature and macbecin on α2C-AR mediated cAMP inhibition in HEK293T cells
A. α2C-AR transfected HEK293T cells (3 μg/10 cm2 dish) were plated in 24 well plates and serum-starved for 24 h. Subsequently, the cells were incubated at 30°C for the periods indicated under the graph. At the end of the incubation period the medium was changed to PBS containing 100 μM IBMX for one hour. Subsequently the cells were pretreated with UK14304 (10 nM) for 5 min, followed by stimulation with forskolin (10 μM) for 15 min. The reactions were stopped by medium aspiration and addition of 200 μl thhricloracetic acid and cAMP levels were determined using cAMP Elisa Kit (Cayman Biochemicals) as described in Material and Methods. B. Same as in A., but the cells were incubated at 37°C or at 30°C in absence or presence of macbecin (5 μM) for 18 h. n=12–15 in each case from three independent transfections. * - shows statistical significant differences between the effects of UK14304 at 37°C and all other series with p < 0.05.
Figure 8
Figure 8. The effects of low-temperature and HSP90 inhibition on the contractile response to α2C-AR stimulation in rat tail artery
A. Cumulative dose-effect contractile response of rat tail artery to UK14304 in presence of L-NAME (100 μM) and α2A-AR antagonist BRL44408 (1 μM). The responses obtained at 37°C (black symbols) and after one hour exposure to 30°C (white symbols) in absence (squares) or after pretreatment with 10 μM macbecin (triangles) are expressed as percentage of the control contraction induced by 100 mM KCl. mean ± SD from four different preparations obtained from four different animals. One-way ANOVA followed by Bonferroni’s Multiple Comparison Test revealed that the contractile effects at 37°C in control arteries are significantly lower compared to the other three conditions. B. Same data as in A presented as maximal contractile response to 100 μM UK14304 at 37°C (left columns) and at 30°C (right columns) in absence (black columns) or presence of 10 μM macbecin (white columns). * - indicate statistical significant differences with p < 0.05.
Figure 9
Figure 9. The influence of temperature on the HSP90 and HSP70 levels in the vascular smooth muscle cells from rat tail artery
A. α2C-AR levels in VSMC from rat tail artery and HEK293T cells. 20 μg of cell lysates obtained from VSMC from rat tail artery (P2, left lanes) and α2C-AR transfected HEK293T (right lanes) maintained for 18 h at 37°C or at 30°C were separated by 10% SDS PAGE. The α2C-AR levels were determined by western blotting using a specific antibody. Similar results were obtained in three other experiments. B. HSP90 and HSP70 levels in VSMC from rat tail artery. VSMC from rat tail artery (P2) were serum starved for 48 h and subsequently maintained at 37°C or exposed to 30°C for 18 h. The cell lysates (20 μg/lane) were separated by 10 % SDS-Page and subject to western-blotting with specific antibodies. A representative blot out of three independent cell isolations is shown. C.. The levels of HSP90 (black column) and HSP70 (white column) at 30°C in VSMC from rat tail artery quantified from the experiments shown in B. Data are expressed as % of the levels of each HSP at 37°C. mean ± SD, from three independent experiments. * - indicate statistical significant differences with p < 0.05.

References

    1. Small KM, McGraw DW, Liggett SB. Pharmacology and physiology of human adrenergic receptor polymorphisms. Annu Rev Pharmacol Toxicol. 2003;43:381–411. - PubMed
    1. Saunders C, Limbird LE. Localization and trafficking of alpha2-adrenergic receptor subtypes in cells and tissues. Pharmacol Ther. 1999;84:193–205. - PubMed
    1. MacDonald E, Kobilka BK, Scheinin M. Gene targeting--homing in on alpha 2-adrenoceptor subtype function. Trends Pharmacol Sci. 1997;18:211–219. - PubMed
    1. Brede M, Philipp M, Knaus A, Muthig V, Hein L. Alpha2-adrenergic receptor subtypes – novel functions uncovered in gene-targeted mouse models. Biol Cell. 2004;96:343–348. - PubMed
    1. Knaus AE, Muthig V, Schickinger S, Moura E, Beetz N, Gilsbach R, Hein L. Alpha2-adrenoceptor subtypes--unexpected functions for receptors and ligands derived from gene-targeted mouse models. Neurochem Int. 2007;51:277–81. - PubMed

Publication types

MeSH terms