Randomized Controlled Trial
. 2011 Feb;138(2):187-200.
doi: 10.1016/j.clim.2010.11.006. Epub 2010 Dec 10.

Oral priming with Salmonella Typhi vaccine strain CVD 909 followed by parenteral boost with the S. Typhi Vi capsular polysaccharide vaccine induces CD27+IgD-S. Typhi-specific IgA and IgG B memory cells in humans

Affiliations
Randomized Controlled Trial

Oral priming with Salmonella Typhi vaccine strain CVD 909 followed by parenteral boost with the S. Typhi Vi capsular polysaccharide vaccine induces CD27+IgD-S. Typhi-specific IgA and IgG B memory cells in humans

Rezwanul Wahid et al. Clin Immunol. 2011 Feb.

Abstract

Attenuated live oral typhoid vaccine candidate CVD 909 constitutively expresses Salmonella Typhi capsular polysaccharide antigen (Vi). A randomized, double-blind, heterologous prime-boost clinical study was conducted to determine whether immunity to licensed parenteral Vi vaccine could be enhanced by priming with CVD 909. Priming with CVD 909 elicited higher and persistent, albeit not significant, anti-Vi IgG and IgA following immunization with Vi, than placebo-primed recipients. Vi-specific IgA B memory (B(M)) cells were significantly increased in CVD 909-primed subjects. S. Typhi-specific LPS and flagella IgA B(M) cells were observed in subjects immunized with CVD 909 or with the licensed Vi-negative oral typhoid vaccine Ty21a. CVD 909-induced B(M) cells exhibited a classical B(M) phenotype (i.e., CD3(-)CD19(+)IgD(-)CD27(+)). This is the first demonstration of classical B(M) cells specific for bacterial polysaccharide or protein antigens following typhoid immunization. The persistent IgA B(M) responses demonstrate the capacity of oral typhoid vaccines to prime mucosally relevant immune memory.


Conflict of interest statement

The remaining authors declare no conflicting financial interests.

Figures

Figure 1
Figure 1. IgM, IgG and IgA serum antibody titers to S. Typhi Vi, LPS and flagella in CVD 909-primed and placebo-primed subjects
Shown are geometric means of IgM, IgG and IgA antibody titers in CVD 909-primed (closed circles) and placebo-primed (open squares) subjects at pre-vaccination (day 0) and days 10, 14, 21, 28, 35, 42, 84, 212 and 365 post-vaccination against Vi (panels A, B, C), LPS (panels D, E, F) and flagella (panels G, H, I). The broken vertical line represents day 21, the time at which all volunteers received the parental Vi vaccine. * p<.05 compared to the corresponding levels in the placebo-primed group.
Figure 2
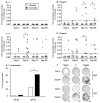
Figure 2. Kinetics of post-vaccination increases in specific BM against S. Typhi Vi and flagella in CVD 909-primed and placebo-primed subjects
Shown are Vi-specific (panels A, C) and flagella-specific (panels B, D) IgG (panels A, B) and IgA (panels C,D) BM cell in CDV 909-primed subjects (closed circles, n=11) and placebo-primed subjects (open circles, n=8). The data are presented as the percentage of antigen specific BM per total IgG or IgA at the indicated days after subtracting day 0 values. The broken horizontal line represents the cut-off for post vaccination responders defined as described in the Methods section. The solid horizontal lines represent the median in each group. The percentages of volunteers who responded to immunization with increased Vi-specific BM in placebo (open bars) and CVD 909 (solid bars) groups are shown in panel E. Panel F shows representative pictures of B ELISpots rendered by the automated counter. * p< 0.05 as compared to the corresponding placebo-primed group.
Figure 3
Figure 3. S. Typhi antigen-specific IgG and IgA BM in volunteers orally vaccinated with Ty21a
Shown are LPS-specific (panels A, C) and flagella-specific (panels B, D); IgG (panels A, B) and IgA (panels C, D) BM cells before (Day 0) and after (Day 70) vaccination with Ty21a. Connecting lines show pre-vaccination (day 0, open circles) and post-vaccination (day 70, solid triangles) levels for each volunteer. The horizontal broken line represents the cut-off for positive BM frequency as described in Materials and Methods.
Figure 4
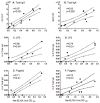
Figure 4. Correlation of antibody titers in culture supernatants of expanded cells and corresponding B ELISpot assays
PBMC samples (n=12) were collected at 3 different time points from each of 4 randomly selected volunteers immunized with Ty21a before and after vaccination. Antibody titers are presented as net OD450 units calculated as the sample OD450 - mean+3SE of the blanks. Total IgG (panel A) and IgA (panel B) antibodies in supernatants were measured at 1:2,000 dilutions, while S. Typhi antigen specific IgG (panels C,E) and IgA (panels D,F) were measured at 1:2 dilutions. Total isotype BM spots (A,B) are presented as SFC/106 expanded cells while antigen specific BM (C,D,E,F) are presented as percentage of the respective total IgG or IgA. The correlation factor r (Spearman) and corresponding P values are shown in each panel.
Figure 5
Figure 5. Representative sequential gating strategy for isolating BM and B naïve subsets by flow cytometry
Shown is a representative gating strategy for the isolation of B cell populations from a volunteer primed with CVD 909 followed by parenteral Vi. Histograms show the phenotype of cells before (panels A, B, C) and after (panels D, E, F and G) sorting. The percentages of cells within the indicated regions are shown in the corresponding histograms.
Figure 6
Figure 6. Measurement of specific antibodies in culture supernatants of sorted BM and naïve subpopulations expanded with B cell mitogens
Antibody titers are shown as net OD450 units (sample OD450 – mean+3 SE of blanks). Shown are results for total IgG (panel A) and specific IgG to LPS (panel B) and S. Typhi flagella (panel C) and total IgA (panel D) and specific IgA to Vi (panel E), LPS (panel F) and S. Typhi flagella (panel G). Total IgG and IgA antibodies in supernatants were measured at 1:1,000 dilutions, while S. Typhi antigen specific IgG and IgA were measured at 1:2 dilutions.

References

    1. Crump JA, Luby SP, Mintz ED. The global burden of typhoid fever. Bull World Health Organ. 2004;82:346–353. - PMC - PubMed
    1. Crump JA, Mintz ED. Global trends in typhoid and paratyphoid Fever. Clin Infect Dis. 2010;50:241–246. - PMC - PubMed
    1. Klugman KP, Koornhof HJ, Robbins JB, Le Cam NN. Immunogenicity, efficacy and serological correlate of protection of Salmonella typhi Vi capsular polysaccharide vaccine three years after immunization. Vaccine. 1996;14:435–438. - PubMed
    1. Levine MM, Ferreccio C, Abrego P, Martin OS, Ortiz E, Cryz S. Duration of efficacy of Ty21a, attenuated Salmonella typhi live oral vaccine. Vaccine. 1999;17(Suppl 2):S22–S27. - PubMed
    1. Hessel L, Debois H, Fletcher M, Dumas R. Experience with Salmonella typhi Vi capsular polysaccharide vaccine. Eur J Clin Microbiol Infect Dis. 1999;18:609–620. - PubMed

Publication types

MeSH terms