Review
. 2011 Feb;5(1):5-23.
doi: 10.1016/j.molonc.2010.11.003. Epub 2010 Nov 24.

Deconstructing the molecular portraits of breast cancer

Affiliations
Review

Deconstructing the molecular portraits of breast cancer

Aleix Prat et al. Mol Oncol. 2011 Feb.

Abstract

Breast cancer is a heterogeneous disease in terms of histology, therapeutic response, dissemination patterns to distant sites, and patient outcomes. Global gene expression analyses using high-throughput technologies have helped to explain much of this heterogeneity and provided important new classifications of cancer patients. In the last decade, genomic studies have established five breast cancer intrinsic subtypes (Luminal A, Luminal B, HER2-enriched, Claudin-low, Basal-like) and a Normal Breast-like group. In this review, we dissect the most recent data on this genomic classification of breast cancer with a special focus on the Claudin-low subtype, which appears enriched for mesenchymal and stem cell features. In addition, we discuss how the combination of standard clinical-pathological markers with the information provided by these genomic entities might help further understand the biological complexity of this disease, increase the efficacy of current and novel therapies, and ultimately improve outcomes for breast cancer patients.


Figures

Figure 1
Figure 1
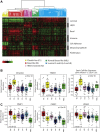
Intrinsic hierarchical clustering and selected gene expression patterns of 337 UNC breast samples data set (publicly available at GSE18229 and https://genome.unc.edu). (A) Average‐linkage hierarchical clustering of genes and arrays was performed using the intrinsic gene list from Parker et al. (2009b), with the sample associated dendrogram colored according to intrinsic subtype. Characteristic expression patterns are highlighted including the Luminal, HER2, Basal, Immune, Cell adhesion, Mesenchymal/Extracellular matrix (ECM) and Proliferation gene clusters. Each colored square represents the relative transcript abundance (in log2 space) with highest expression being red, average expression being black, and lowest expression being green. (B) Mesenchymal and stem cell‐like gene expression in Claudin‐low tumors shown using ANOVA analysis for each subtype. The Stem Cell‐like Signature (CD44+/PROCR+ vs. CD24+) was obtained from Shipitsin et al. (2007), and a enrichment/activity score was derived by calculating the inner product of this signature (gene ratio) and the gene expression value of each tumor sample. (C) DNA‐repair (PARP1 and CHEK1) and angiogenesis (VEGFA) gene expression for individual genes across the subtypes.
Figure 2
Figure 2
Selected histological features of the intrinsic subtypes of breast cancer. (A–C) Dual label immuno‐fluorescence analysis of a Claudin‐low sample with tumor cells positive for vimentin (green, A), keratin 5/19 (red, B) and both (yellow, white arrows, C). (D) Basal‐like sample with EGFR/HER1 positive staining. (E) Basal‐like sample with keratin 5/6 positive staining. (F) Well‐differentiated Luminal A tumor with strong ER‐positivity. (G) Poorly differentiated Luminal B tumor with weak/moderate ER‐positivity. (H) HER2‐enriched tumor with strong membrane staining for HER2. (I) Claudin‐low tumor with brisk lymphocytic infiltration (black arrows). This figure has been modified from Prat et al. (2010).
Figure 3
Figure 3
Identification of the Claudin‐low profile in breast cancer cell lines. (A) Intrinsic Gene clusters selected in Figure 1 are shown here using the cell line gene expression data set of Neve et al. (2006). The sample associated dendrogram has been derived by semi‐unsupervised hierarchical clustering using the intrinsic list from Parker et al. (2009b) and the 51 cell lines of Neve et al. Claudin‐low cell lines are shown in yellow. Each colored square represents the relative transcript abundance (in log2 space) with highest expression being red, average expression being black, and lowest expression being green. (B) Mean expression of the top highly expressed (n = 833) and lowly expressed (n = 642) genes in Claudin‐low cell lines across 337 human breast tumor samples classified according to intrinsic subtype, including the Normal Breast‐like group. Both gene lists were obtained by performing Significance Analysis Microarray (SAM) between Claudin‐low breast cancer cell lines vs. the rest (FDR<5%). BL, Basal‐like; CL, Claudin‐low; H2, HER2‐enriched; LA, Luminal A; LB, Luminal B; NBL, Normal Breast‐like. This figure has been modified from Prat et al. (2010).
Figure 4
Figure 4
Expression of inflammatory response/angiogenesis biological processes genes across 52 breast cancer cell lines. (A) Selected expression of genes involved in wound response, angiogenesis and/or inflammatory response. The sample/cell line associated dendrogram was derived by semi‐unsupervised hierarchical clustering using the intrinsic list from Parker et al. (2009b). Claudin‐low cell lines are shown in yellow color. (B) Selected highly expressed Gene Ontology (GO) terms in Claudin‐low cell lines. The highly expressed gene list was obtained by SAM between Claudin‐low breast cancer cell lines vs. rest (FDR<5%). Biologic analysis of microarray data was performed with DAVID annotation tool (http://david.abcc.ncifcrf.gov/) (Dennis et al., 2003).
Figure 5
Figure 5
Clinical‐pathological characteristics of the current intrinsic subtypes of breast cancer. (A) Table summarizing the percentages of the different pathological variables across three microarray data sets with clinical information (UNC337, NKI295 (van 't Veer et al., 2002) and MDACC133). (B) Kaplan–Meier relapse‐free survival and overall survival curves using the UNC337 data set with Normal Breast‐like samples excluded. This figure has been modified from Prat et al. (2010).
Figure 6
Figure 6
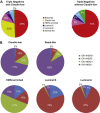
Distribution of clinical‐pathological categories relative to the intrinsic subtypes of breast cancer. (A) Intrinsic subtype distribution within the triple‐negative tumor category shown with and without Claudin‐low tumors. (B) Distribution of ER+/HER2+, ER−/HER2+, ER−/HER2− clinical groups in the Claudin‐low, Basal‐like, HER2‐enriched, Luminal B, and Luminal A within each subtype.
Figure 7
Figure 7
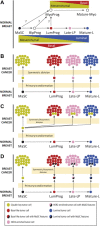
Possible developmental origins of the intrinsic breast cancer subtypes. (A) Normal mammary luminal and myoepithelial differentiation hierarchies with approximate genomic expression patterns of mesenchymal, basal, and luminal profiles highlighted. (B) Hypothesis 1: each molecular subtype originates in a normal epithelial cell along the luminal differentiation hierarchy. Aberrant symmetric division expands each subpopulation of cells to form the bulk of the tumor, which is composed entirely of TICs. (C) Hypothesis 2: the MaSC subpopulation is the cell of origin of all breast cancers and depending upon its genetic alterations, a given tumor arrests at a distinct stage of development. (D) Hypothesis 3: each molecular subtype originates in a normal epithelial cell along the luminal differentiation hierarchy. However, the transformation events (genetically and/or via microenvironment influences) render differentiated cells with MaSC‐like features including the ability to self‐renew and divide asymmetrically. Abbreviations: MaSC, mammary stem cell; MyoProg, myoepithelial progenitor; Mature‐Myo, mature myoepithelial cells; LumProg, luminal progenitor; Late‐LP, late luminal progenitor; Mature‐L, mature luminal cells.

References

    1. Agus, D.B. , Akita, R.W. , Fox, W.D. , Lewis, G.D. , Higgins, B. , Pisacane, P.I. , Lofgren, J.A. , Tindell, C. , Evans, D.P. , Maiese, K. , Scher, H.I. , Sliwkowski, M.X. , 2002. Targeting ligand-activated ErbB2 signaling inhibits breast and prostate tumor growth. Cancer Cell. 2, 127 - PubMed
    1. Al Sayed, A.D. , El Weshi, A.N. , Tulbah, A.M. , Rahal, M.M. , Ezzat, A.A. , 2006. Metaplastic carcinoma of the breast clinical presentation, treatment results and prognostic factors. Acta. Oncol. 45, 188–195. - PubMed
    1. Al-Hajj, M. , Wicha, M. , Benito-Hernandez, A. , Morrison, S. , Clarke, M. , 2003. Prospective identification of tumorigenic breast cancer cells. Proc. Natl. Acad. Sci. U S A. 100, 3983–3988. - PMC - PubMed
    1. Benz, C. , Scott, G. , Sarup, J. , Johnson, R. , Tripathy, D. , Coronado, E. , Shepard, H. , Osborne, C. , 1992. Estrogen-dependent, tamoxifen-resistant tumorigenic growth of MCF-7 cells transfected with HER2/neu. Breast Cancer Res. Treat. 24, 85–95. - PubMed
    1. Carey, L.A. , Perou, C.M. , Livasy, C.A. , Dressler, L.G. , Cowan, D. , Conway, K. , Karaca, G. , Troester, M.A. , Tse, C.K. , Edmiston, S. , Deming, S.L. , Geradts, J. , Cheang, M.C. , Nielsen, T.O. , Moorman, P.G. , Earp, H.S. , Millikan, R.C. , 2006. Race, breast cancer subtypes, and survival in the Carolina Breast Cancer Study. JAMA. 295, 2492–2502. - PubMed

Publication types