

Retinal degeneration in two lines of transgenic S334ter rats
- PMID: 21147100
- PMCID: PMC3073728
- DOI: 10.1016/j.exer.2010.12.001
Retinal degeneration in two lines of transgenic S334ter rats
Abstract
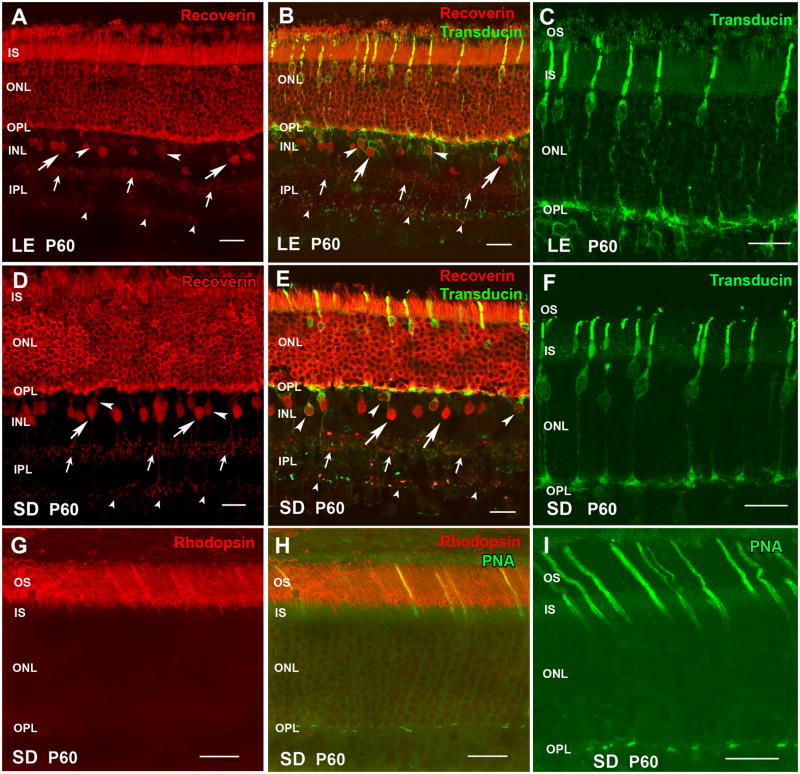
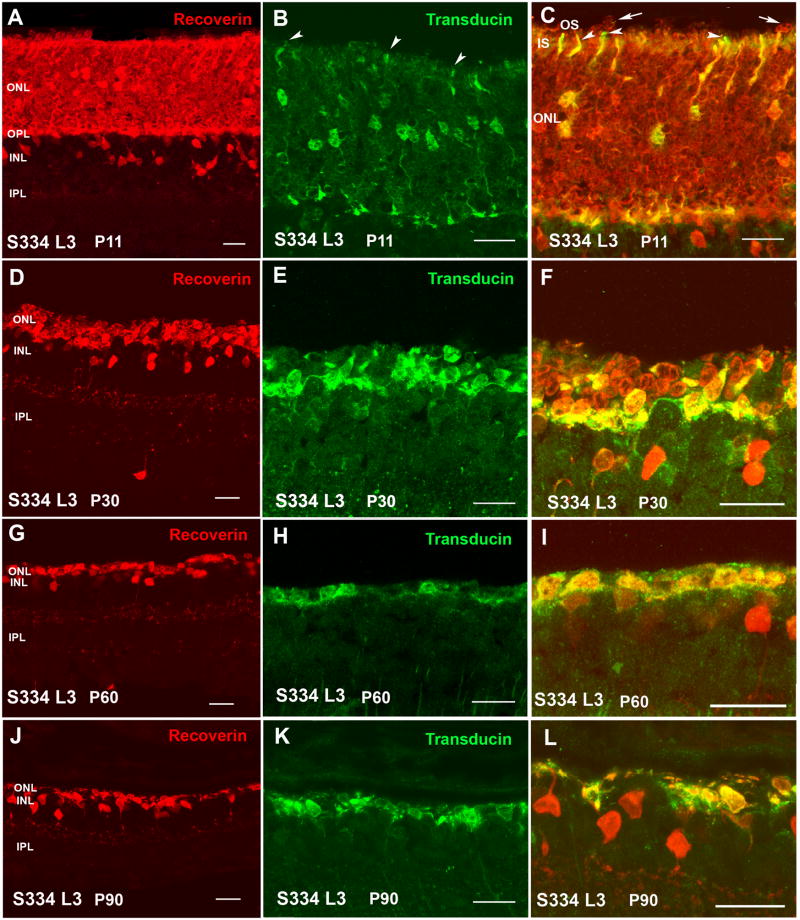
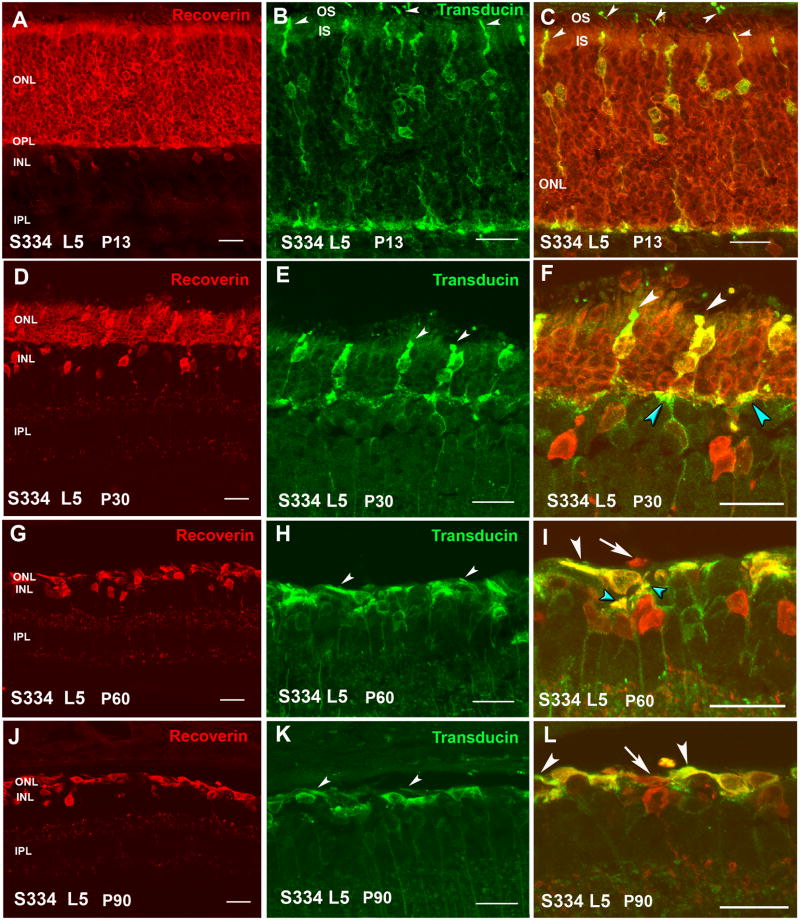
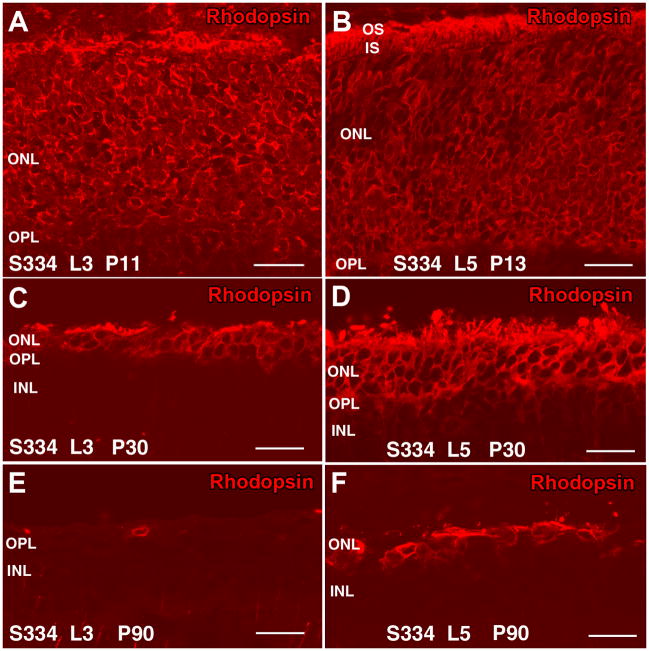
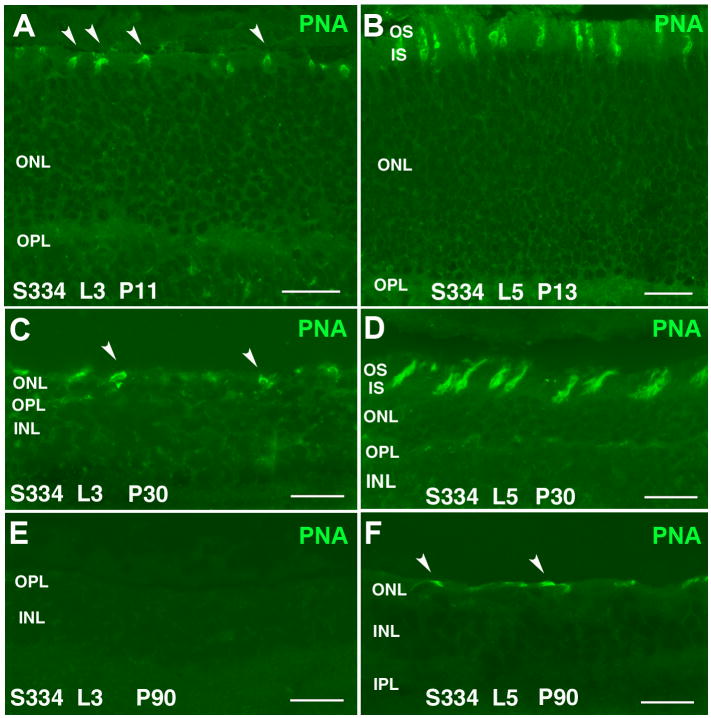
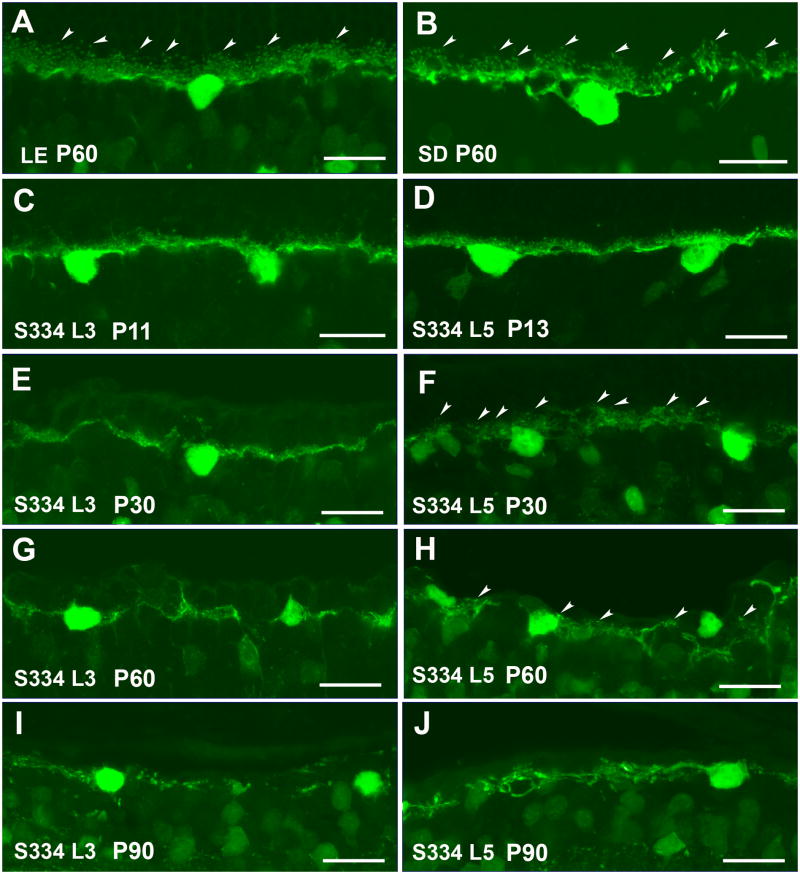
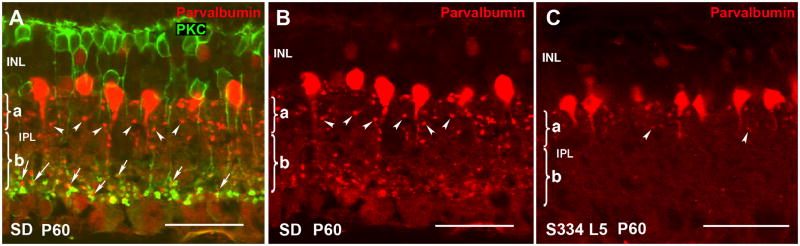
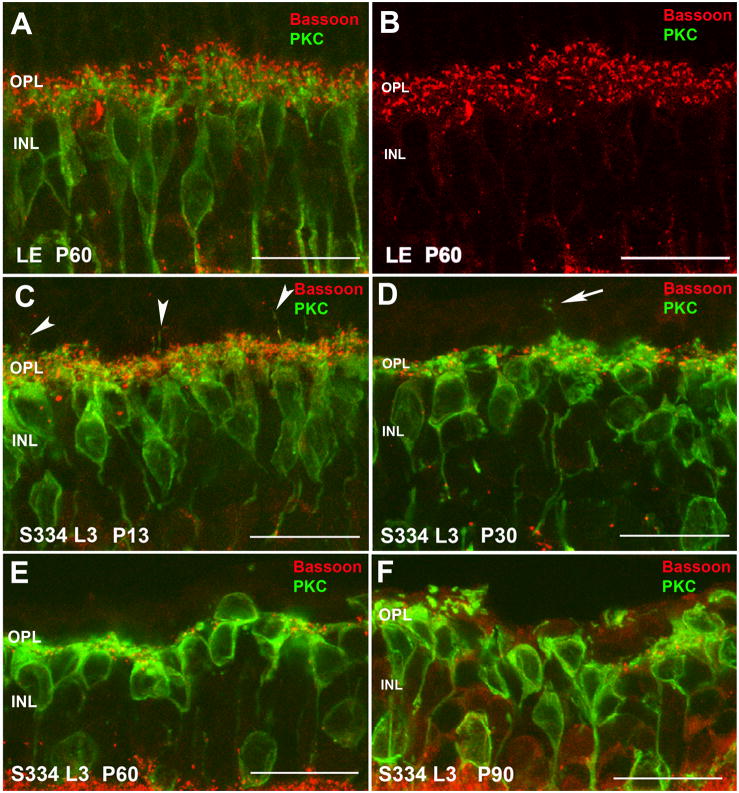
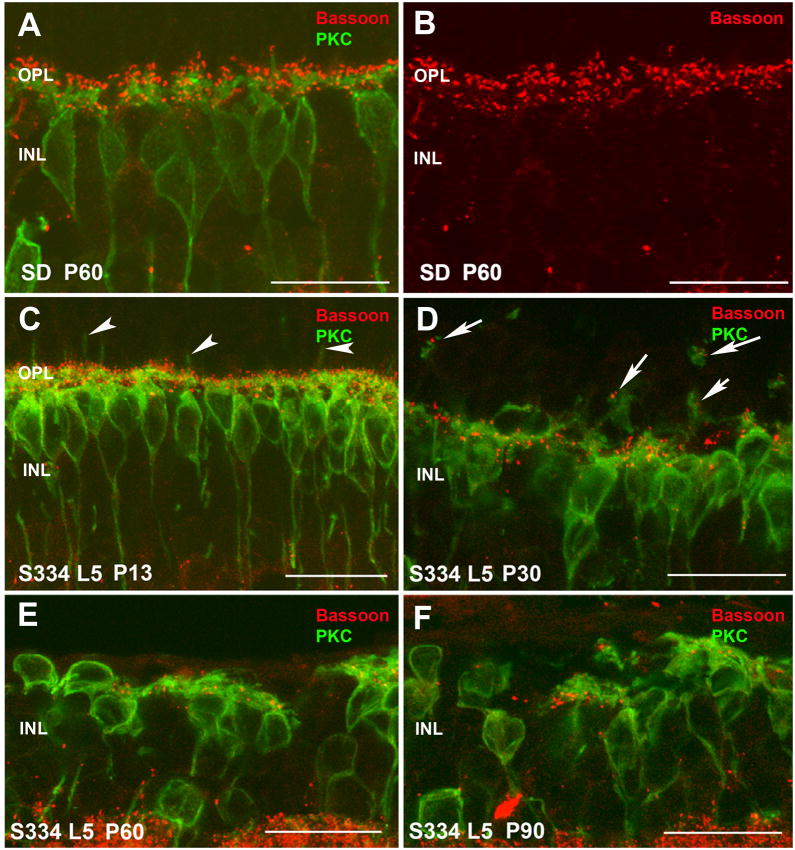
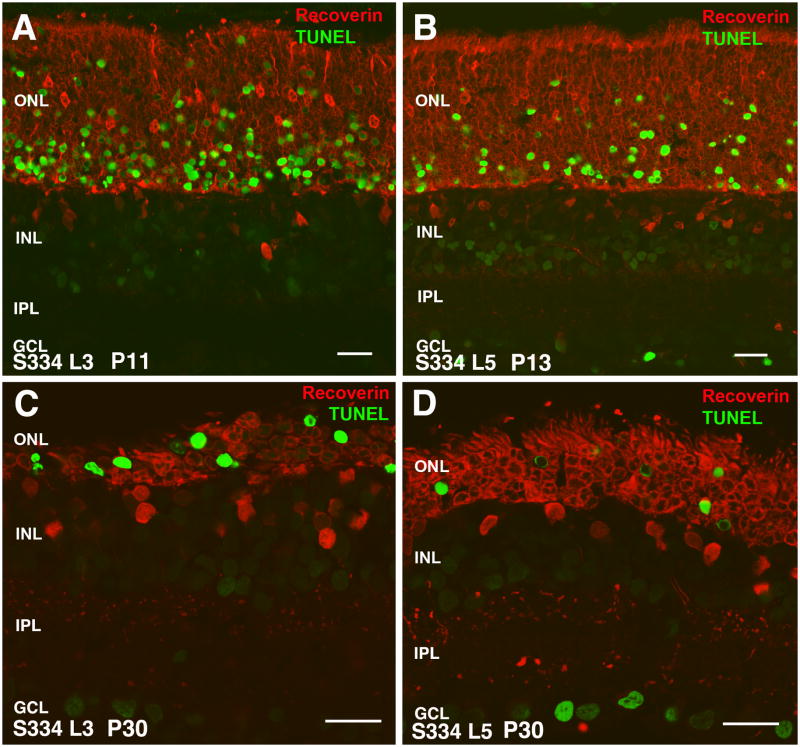
Aim of this study was to examine synaptic connectivity changes in the retina and the location and rate of apoptosis in transgenic S334ter line-3 and line-5 rats with photoreceptor degeneration. Heterozygous S334ter-line-3 and line-5 at P11-13, P30, P60, P90 and several control non-dystrophic rats (Long Evans and Sprague-Dawley) at P60, were studied anatomically by immunohistochemistry for various cell and synaptic markers, and by PNA and TUNEL label.- S334ter line-3 exhibited the fastest rate of degeneration with an early loss of photoreceptors, with 1-2 layers remaining at P30, and only cones left at P60. Line-5 had 4-5 layers left at P30, and very few rods left at P60-90. In both lines, horizontal cell processes (including dendrites and axon) were diminished at P11-13, showing gaps in the outer plexiform layer (OPL) at P60, and at P90, almost no terminal tips could be seen. Bipolar cells showed a retraction of their dendrites forming clusters along the OPL. Synaptic terminals of A-II amacrine cells in the IPL lost most of their parvalbumin-immunoreactivity. The apoptosis rate was different in both lines. Line-3 rats showed many photoreceptors affected at P11, occupying the innermost part of the outer nuclear layer. Line-5 showed a lower number of apoptotic cells within the same location at P13. In summary, the S334ter line-3 rat has a faster progression of degeneration than line-5. The horizontal and bipolar terminals are already affected at P11-P13 in both models. Apoptosis is related to the mutated rhodopsin transgene; the first photoreceptor cells affected are those close to the OPL.
Copyright © 2010 Elsevier Ltd. All rights reserved.
Figures
Similar articles
-
Morphological alterations in retinal neurons in the S334ter-line3 transgenic rat.Cell Tissue Res. 2010 Mar;339(3):481-91. doi: 10.1007/s00441-009-0916-5. Epub 2010 Feb 2. Cell Tissue Res. 2010. PMID: 20127257
-
The relationship of photoreceptor degeneration to retinal vascular development and loss in mutant rhodopsin transgenic and RCS rats.Exp Eye Res. 2008 Dec;87(6):561-70. doi: 10.1016/j.exer.2008.09.004. Epub 2008 Sep 24. Exp Eye Res. 2008. PMID: 18848932 Free PMC article.
-
Immunohistochemical evidence of synaptic retraction, cytoarchitectural remodeling, and cell death in the inner retina of the rat model of oygen-induced retinopathy (OIR).Invest Ophthalmol Vis Sci. 2011 Mar 25;52(3):1693-708. doi: 10.1167/iovs.10-6197. Invest Ophthalmol Vis Sci. 2011. PMID: 21071736
-
Optomotor and immunohistochemical changes in the juvenile S334ter rat.Exp Eye Res. 2012 Nov;104:65-73. doi: 10.1016/j.exer.2012.09.006. Epub 2012 Oct 1. Exp Eye Res. 2012. PMID: 23036564 Free PMC article.
-
Retinal cAMP levels during the progression of retinal degeneration in rhodopsin P23H and S334ter transgenic rats.Invest Ophthalmol Vis Sci. 2002 May;43(5):1655-61. Invest Ophthalmol Vis Sci. 2002. PMID: 11980887
Cited by
-
Detailed Visual Cortical Responses Generated by Retinal Sheet Transplants in Rats with Severe Retinal Degeneration.J Neurosci. 2018 Dec 12;38(50):10709-10724. doi: 10.1523/JNEUROSCI.1279-18.2018. Epub 2018 Nov 5. J Neurosci. 2018. PMID: 30396913 Free PMC article.
-
Effects of a metabotropic glutamate 1 receptor antagonist on light responses of retinal ganglion cells in a rat model of retinitis pigmentosa.PLoS One. 2013 Oct 28;8(10):e79126. doi: 10.1371/journal.pone.0079126. eCollection 2013. PLoS One. 2013. PMID: 24205371 Free PMC article.
-
A clinically viable approach to restoring visual function using optogenetic gene therapy.Mol Ther Methods Clin Dev. 2023 May 9;29:406-417. doi: 10.1016/j.omtm.2023.05.005. eCollection 2023 Jun 8. Mol Ther Methods Clin Dev. 2023. PMID: 37251979 Free PMC article.
-
Inhibitory peptide of mitochondrial μ-calpain protects against photoreceptor degeneration in rhodopsin transgenic S334ter and P23H rats.PLoS One. 2013 Aug 9;8(8):e71650. doi: 10.1371/journal.pone.0071650. eCollection 2013. PLoS One. 2013. PMID: 23951212 Free PMC article.
-
A new immunodeficient pigmented retinal degenerate rat strain to study transplantation of human cells without immunosuppression.Graefes Arch Clin Exp Ophthalmol. 2014 Jul;252(7):1079-92. doi: 10.1007/s00417-014-2638-y. Epub 2014 May 13. Graefes Arch Clin Exp Ophthalmol. 2014. PMID: 24817311 Free PMC article.
References
-
- An GJ, Asayama N, Humayun MS, Weiland J, Cao J, Kim SY, Grebe R, de Juan E, Jr, Sadda S. Ganglion cell responses to retinal light stimulation in the absence of photoreceptor outer segments from retinal degenerate rodents. Curr Eye Res. 2002;24:26–32. - PubMed
-
- Barhoum R, Martinez-Navarrete G, Corrochano S, Germain F, Fernandez-Sanchez L, de la Rosa EJ, de la Villa P, Cuenca N. Functional and structural modifications during retinal degeneration in the rd10 mouse. Neuroscience. 2008;155:698–713. - PubMed
-
- Berger W, Kloeckener-Gruissem B, Neidhardt J. The molecular basis of human retinal and vitreoretinal diseases. Prog Retin Eye Res. 2010;29:335–75. - PubMed
-
- Brandstatter JH, Fletcher EL, Garner CC, Gundelfinger ED, Wässle H. Differential expression of the presynaptic cytomatrix protein bassoon among ribbon synapses in the mammalian retina. Eur J Neurosci. 1999;11:3683–93. - PubMed
-
- Cuenca N, Pinilla I, Sauve Y, Lu B, Wang S, Lund RD. Regressive and reactive changes in the connectivity patterns of rod and cone pathways of P23H transgenic rat retina. Neuroscience. 2004;127:301–17. - PubMed
Publication types
MeSH terms
Substances
Grants and funding
LinkOut - more resources
Full Text Sources
Other Literature Sources
