. 2011 Mar;140(3):1071-83.
doi: 10.1053/j.gastro.2010.12.006. Epub 2010 Dec 11.

Increased lipogenesis, induced by AKT-mTORC1-RPS6 signaling, promotes development of human hepatocellular carcinoma

Affiliations

Increased lipogenesis, induced by AKT-mTORC1-RPS6 signaling, promotes development of human hepatocellular carcinoma

Diego F Calvisi et al. Gastroenterology. 2011 Mar.

Abstract

Background & aims: De novo lipogenesis is believed to be involved in oncogenesis. We investigated the role of aberrant lipid biosynthesis in the pathogenesis of human hepatocellular carcinoma (HCC).

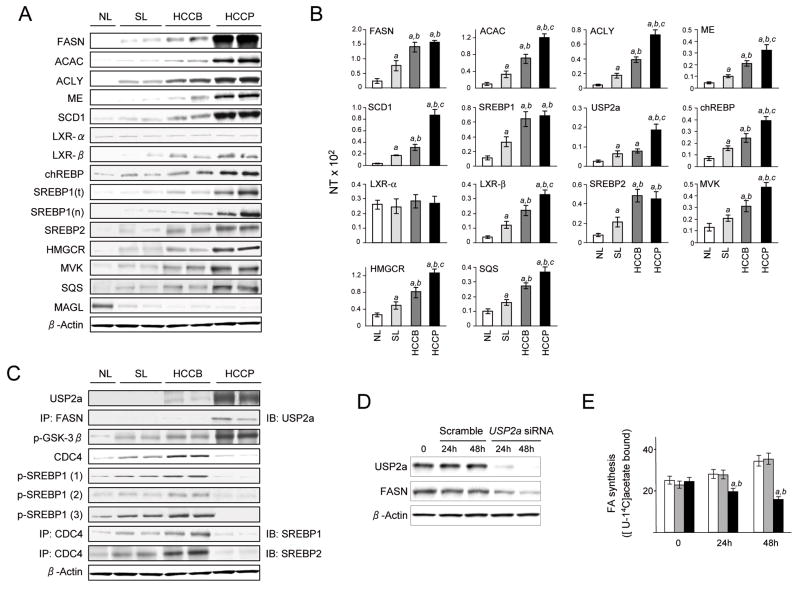
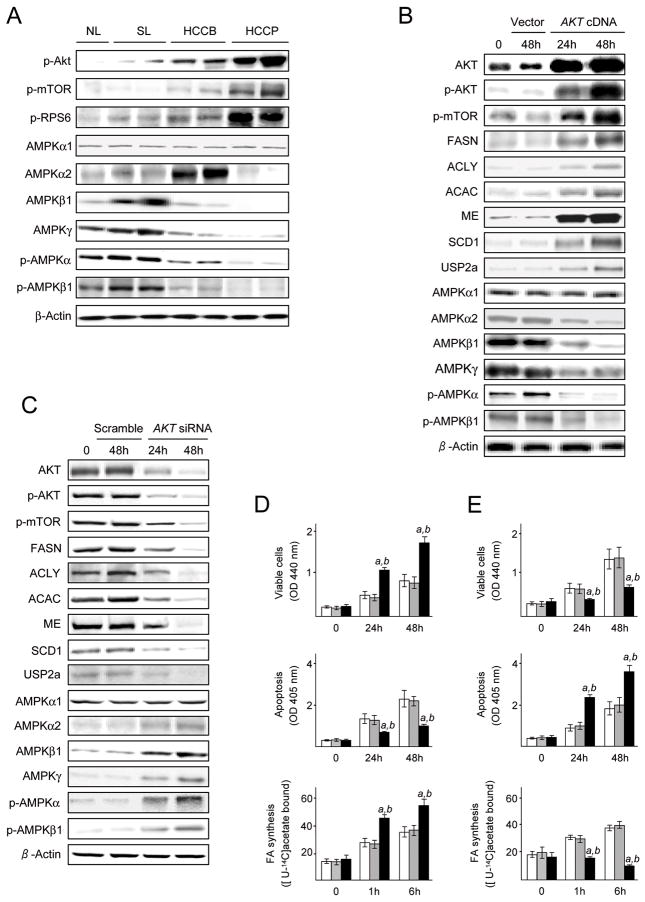
Methods: We evaluated expression of enzymes that regulate lipogenesis in human normal liver tissues and HCC and surrounding, nontumor, liver tissues from patients using real-time reverse transcription polymerase chain reaction, immunoblotting, immunohistochemistry, and biochemical assays. Effects of lipogenic enzymes on human HCC cell lines were evaluated using inhibitors and overexpression experiments. The lipogenic role of the proto-oncogene AKT was assessed in vitro and in vivo.

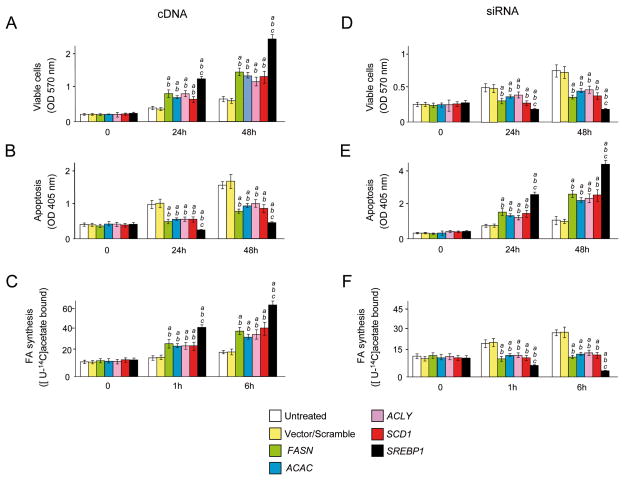
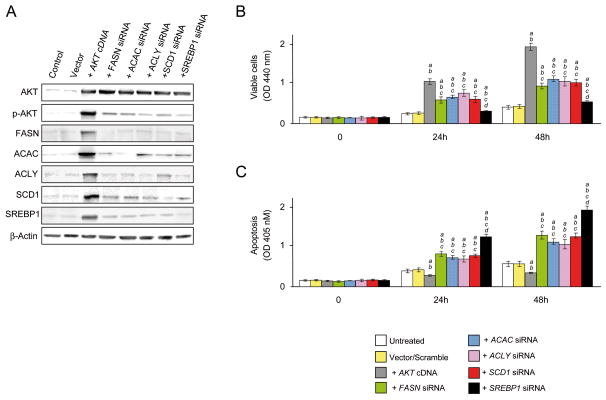
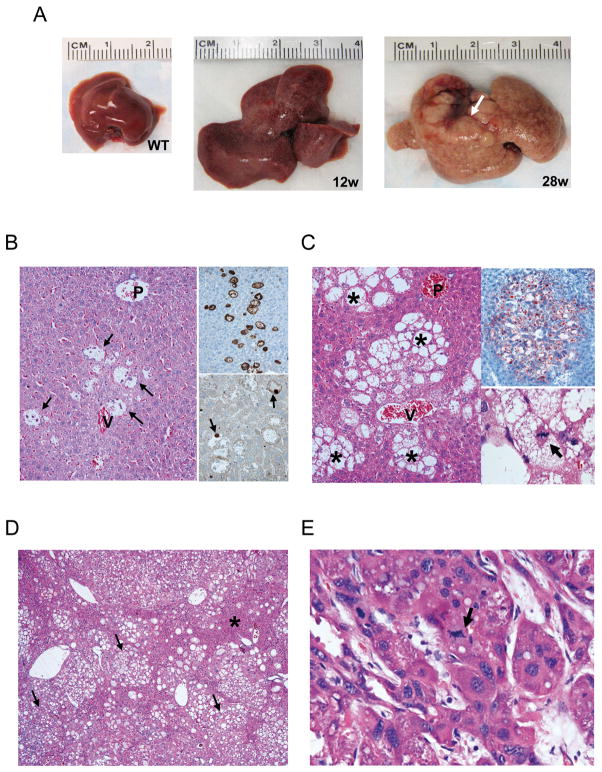
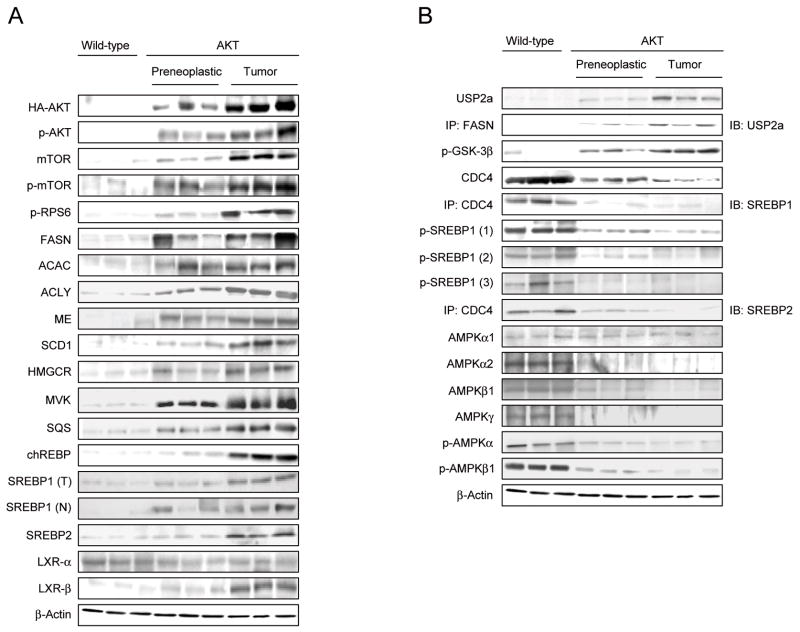
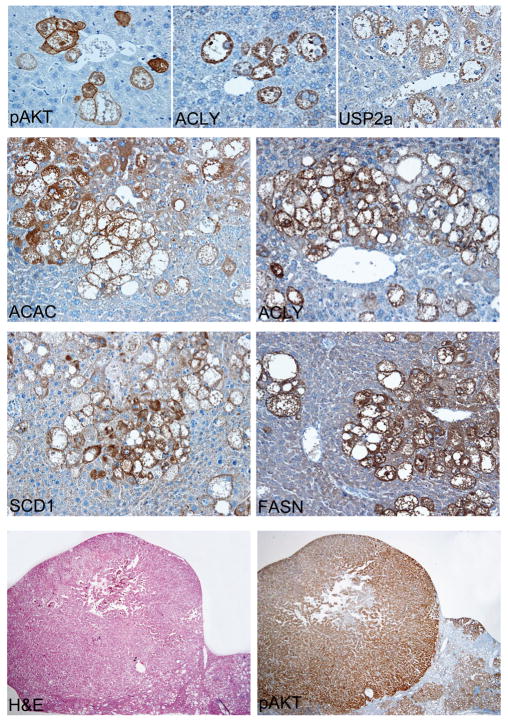
Results: In human liver samples, de novo lipogenesis was progressively induced from nontumorous liver tissue toward the HCC. Extent of aberrant lipogenesis correlated with clinical aggressiveness, activation of the AKT-mammalian target of rapamycin signaling pathway, and suppression of adenosine monophosphate-activated protein kinases. In HCC cell lines, the AKT-mammalian target of rapamycin complex 1-ribosomal protein S6 pathway promoted lipogenesis via transcriptional and post-transcriptional mechanisms that included inhibition of fatty acid synthase ubiquitination by the USP2a de-ubiquitinase and disruption of the SREBP1 and SREBP2 degradation complexes. Suppression of the genes adenosine triphosphate citrate lyase, acetyl-CoA carboxylase, fatty acid synthase, stearoyl-CoA desaturase 1, or sterol regulatory element-binding protein 1, which are involved in lipogenesis, reduced proliferation, and survival of HCC cell lines and AKT-dependent cell proliferation. Overexpression of an activated form of AKT in livers of mice induced lipogenesis and tumor development.

Conclusions: De novo lipogenesis has pathogenic and prognostic significance for HCC. Inhibitors of lipogenic signaling, including those that inhibit the AKT pathway, might be useful as therapeutics for patients with liver cancer.


Conflict of interest statement

Disclosures: The Authors state the absence of any conflict of interest to disclose

Figures

Figure 1
Figure 1
Activation of lipogenic proteins in human liver cancer. (A) Representative immunoblotting of the major lipogenic proteins and transcription factors involved in lipogenesis. Both total (T) and nuclear (N) levels of SREBP1 were determined. (B) mRNA levels of lipogenic enzymes and pro-lipogenic transcription factor were determined by quantitative real-time PCR. NT (Number Target) = 2−ΔCt; ΔCt = Ct RNR18-Ct target gene. Tukey-Kramer test: P < 0.0001 a, vs. NL; b vs. SL; c vs. HCCB. (C) Assessment of FASN and SREBPs regulators by immunoblotting. SREBP1 phosphorylation sites, Thr-426, Ser-430, and Ser-434, are indicated as 1, 2, and 3 in the figure. Data from SL of HCCB and HCCP did not show statistical differences, and are thus merged. (D,E) Suppression of USP2a by siRNA in Hep40 cell line leads to FASN downregulation (D), and decrease in FA synthesis (E). Equivalent results were obtained in SNU-182 cells (not shown). (E) White, gray, or black bars indicate untreated cells, treated with scramble, or with anti-USP2a siRNA, respectively. Tukey-Kramer test: P < 0.0001 a, vs. untreated cells; b, vs. scramble siRNA-treated cells. Abbreviations: IB, immunoblotting; IP, immunoprecipitation; NL, normal liver; SL, surrounding liver; HCCB, HCC with better outcome (longer survival); HCCP, HCC with poorer outcome (shorter survival).
Figure 2
Figure 2
(A) Activation of Akt, mTOR, and loss of AMPK proteins in human HCC. Whole cell lysates were prepared from normal livers (NL), surrounding livers (SL), and HCC with better (HCCB) or poorer (HCCP) outcome and immunoblotted with indicated antibodies. Data from SL of HCCB and HCCP did not show statistical differences, and are thus merged. (B) Effect of overexpressing activated AKT in HLE cell lines on the levels of the major players of lipogenesis and AMPK proteins. Equivalent results were obtained in SNU-423 cells (not shown). (C) Effect of suppression of AKT by siRNA in HuH1 cells on the levels of lipogenesis modulators and AMPK proteins. Equivalent results were obtained in SNU-389 cells (not shown). (D,E) Effect of overexpressing (D) or silencing (E) AKT in HLE and HuH1 cells, respectively, on cell viability (first panel), apoptosis (second panel), and fatty acid synthesis (third panel). White bars, control (untreated cells); grey bars, transfection of vector alone (D) or scramble siRNA (E); black bars, transfection of either AKT cDNA (D) of siRNA against AKT1/2 (E). Each bar represents mean ± SD. Tukey-Kramer test: P < 0.0001 a, vs. control (untreated cells); b, vs. empty vector or scramble siRNA.
Figure 3
Figure 3
Effect of forced overexpression of FASN, ACAC, ACLY, SCD1, and SREBP1 cDNA via transient transfection in 7703 cell line (expressing low levels of the 5 lipogenic proteins) on cell viability (A), apoptosis (B) and fatty acid synthesis (C). Equivalent results were obtained in Focus cells (not shown). Effect of FASN, ACAC, ACLY, SCD1, and SREBP1 silencing via siRNA in HuH1 cells (expressing high levels of the 5 proteins) on cell viability (D), apoptosis (E) and fatty acid synthesis (F). Equivalent results were obtained in SNU-389 cells. Each bar represents mean ± SD. Tukey-Kramer test: P < 0.0001 a, vs. control (untreated cells); b, vs. empty vector or scramble siRNA; c, vs. lipogenic enzymes.
Figure 4
Figure 4
Effect of inactivating FASN, ACAC, ACLY, SCD1, and SREBP1 expression via siRNA in HLE cells stably transfected with myristylated/activated AKT. (A) Representative immunoblotting on the levels of AKT, FASN, ACAC, ACLY, SCD1, and SREBP1 following overexpression of myristylated AKT by stable transfection (+ AKT cDNA) and silencing of the 5 lipogenic proteins in HLE cells. Effect of FASN, ACAC, ACLY, SCD1, and SREBP1 silencing via siRNA on the growth of HLE cells stably transfected with myristylated AKT (+ AKT cDNA) on cell viability (B) and apoptosis (C). Each bar represents mean ± SD of 3 independent experiments conducted in triplicate. Tukey-Kramer test: P < 0.0001 a, vs. control (untreated cells); b, vs. vector alone; c, vs. AKT-transfected-only cells; d, vs. lipogenic enzymes.
Figure 5
Figure 5
Stepwise development of hepatocarcinogenesis in AKT-overexpressing mice by hydrodynamic gene delivery. (A) Macroscopic appearance of wild-type and AKT-injected livers (the latter analyzed 12 and 28 weeks after hydrodynamic injection). The livers of mice injected with myristylated AKT 12 weeks before (12w) showed a spotty and paler appearance than of normal controls (wild-type mice; WT) and were considerably enlarged, as indicated by the scale bar above the livers. The changes were much more prominent and several large tumors emerged 28 weeks after injection (28w; the arrow indicates a large HCC). (B) Histological features of AKT overexpressing livers 3 days after hydrodynamic injection. At this early time point, the first alterations in the liver tissue were noted: several altered hepatocytes emerged in the liver (some marked by arrows), characterized by a massively enlarged clear cytoplasm. Lesional cells were mostly located in the acinar zone 3 (v, the hepatic vein) while the periportal hepatocytes (acinar zone 1; p, portal tract) remain unaffected (B; main panel). Immunohistochemically, these cells were proven to harbor HA-Tag (brown staining; B, top right panel), and the increased nuclear expression of PCNA (indicated by arrows; B, bottom right panel) indicated their proliferative activity. (C) Twelve weeks after hydrodynamic injection, as a consequence of the proliferation of AKT overexpressing preneoplastic cells, approximately 50% of the liver was occupied by clear-cell preneoplastic foci, consisting of large clusters of cells (indicated by asterisks; C, main panel). Owing to their size, the lesions more often expanded into the periportal areas (acinar zones 1 and 2), although they were still mainly located in the acinar zone 3 (v: hepatic vein; p: portal tract). The cytoplasm of altered cells was rich in lipids (Oil red O staining; C top right panel). In larger lesions, occasional mitotic figures (indicated by an arrow) were visible (C, bottom right panel). (D) Twenty-eight weeks after hydrodynamic injection, approximately 80% of the liver was occupied by lesional tissue (indicated by arrows; the asterisk marks an area of normal tissue), and hepatocellular carcinoma developed (E). These tumors displayed a macrotrabecular growth, considerably less intracytoplasmic lipid but increased cytoplasmic basophilia, significant nuclear atypia, and multiple mitotic figures (indicated by an arrow). Bottom edge of the pictures of the panels represents: 0.4 mm (B, main and bottom right panel; C, main and top right panel); 0.2 mm (B, top right panel; E); 0.1 mm (C; bottom right panel); 2.5 mm (D).
Figure 6
Figure 6
Activation of lipogenic proteins in liver lesions from mice injected with myristylated Akt. (A) Immunoblot analysis of AKT, mTOR, and their downstream lipogenic effectors in uninjected wild-type livers and preneoplastic livers and tumors (hepatocellular adenomas and carcinomas) from AKT-injected mice. (B) Expression of USP2a, CDC4, phosphorylated/inactivated GSK-3β and SREBP1, and AMPK proteins in liver lesions from mice injected with AKT. Six to eight samples per each group were used for the analysis, and representative images are shown. β-Actin was used as loading control. Abbreviations: IB, immunoblotting; IP, immunoprecipitation.
Figure 7
Figure 7
Activation of AKT, USP2a, and members of the lipogenic pathway in mice overexpressing myristylated AKT, as assessed by immunohistochemistry. The first row shows overexpression of phosphorylated/activated AKT, ACLY (as one example for lipogenic enzymes) and USP2a in preneoplastic hepatocytes, 3 days after injection. The middle block of 4 panels demonstrates the combined overexpression of ACAC, ACLY, SCD1, and FASN lipogenic enzymes in preneoplastic livers, 12 weeks after injection. Identical results were observed in hepatocellular tumors. In the bottom row, an example of a large hepatocellular adenoma and surrounding admixed preneoplastic and normal liver tissue is depicted (serial sections), showing AKT overexpression. Note the stronger AKT immunoreactivity in the tumor when compared with neighbouring preneoplastic cells (28 weeks after injection). Bottom edge of the pictures of the panels represents 0.25 mm in the upper row, 0.5 mm in the middle block, and 5 mm in the bottom row.

Similar articles

Cited by

References

    1. Bruix J, Boix L, Sala M, et al. Focus on hepatocellular carcinoma. Cancer Cell. 2004;5:215–219. - PubMed
    1. Thorgeirsson SS, Grisham JW. Molecular pathogenesis of human hepatocellular carcinoma. Nat Genet. 2002;31:339–346. - PubMed
    1. Hajer GR, van Haeften TW, Visseren FL. Adipose tissue dysfunction in obesity, diabetes, and vascular diseases. Eur Heart J. 2008;29:2959–2971. - PubMed
    1. Kuhajda FP. Fatty-acid Synthase and human cancer: new perspectives on its role in tumor biology. Nutrition. 2000;16:202–208. - PubMed
    1. Swinnen JV, Brusselmans K, Verhoeven G. Increased lipogenesis in cancer cells: new players, novel targets. Curr Opin Clin Nutr Metab Care. 2006;9:358–365. - PubMed

Publication types

MeSH terms