. 2011 Mar 1;20(5):927-40.
doi: 10.1093/hmg/ddq531. Epub 2010 Dec 7.

Bioenergetics of neurons inhibit the translocation response of Parkin following rapid mitochondrial depolarization

Affiliations

Bioenergetics of neurons inhibit the translocation response of Parkin following rapid mitochondrial depolarization

Victor S Van Laar et al. Hum Mol Genet. .

Abstract

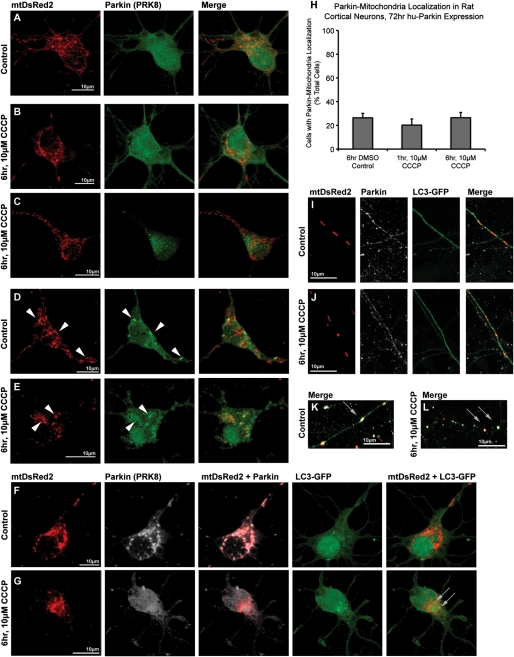
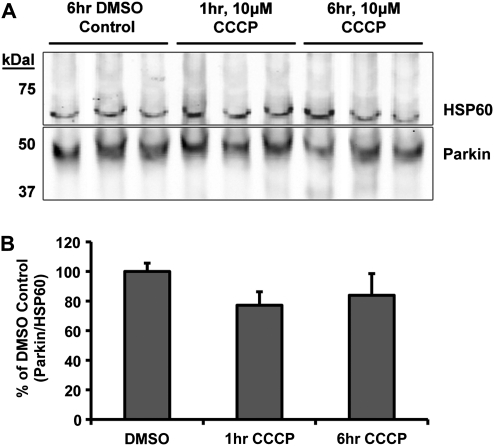
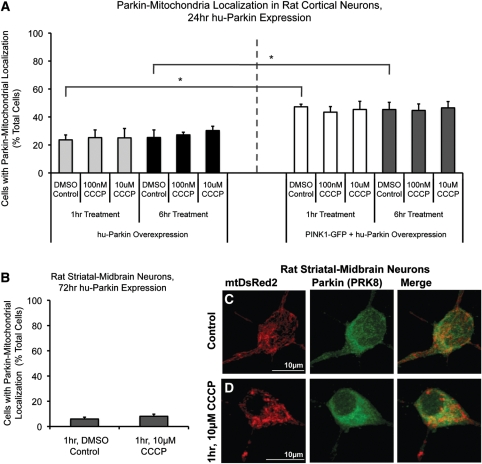
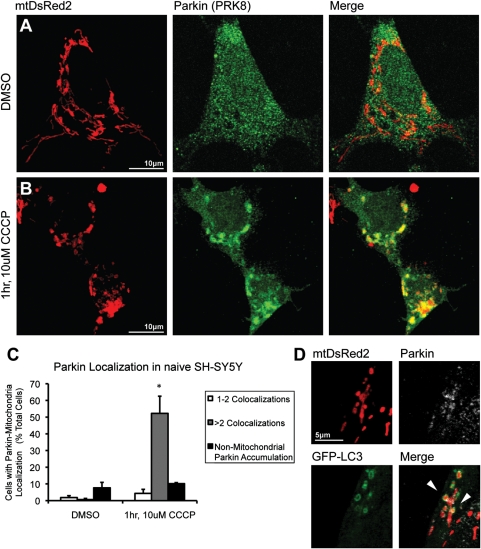
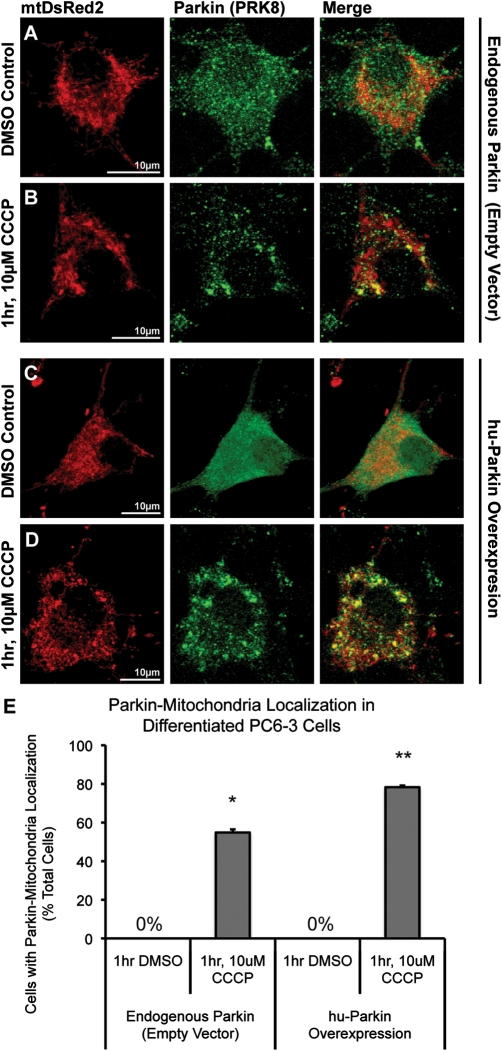
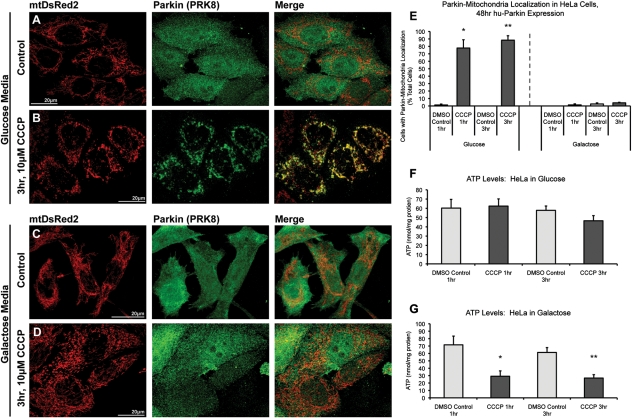
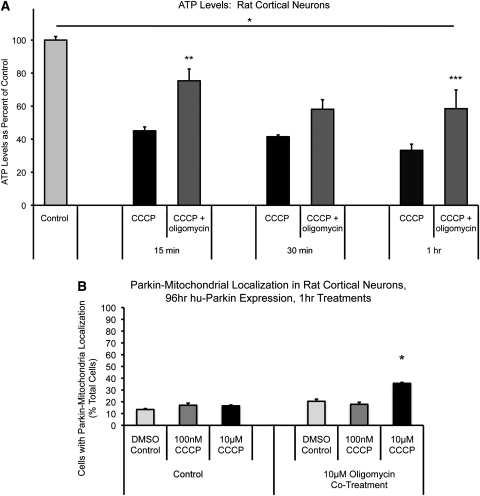
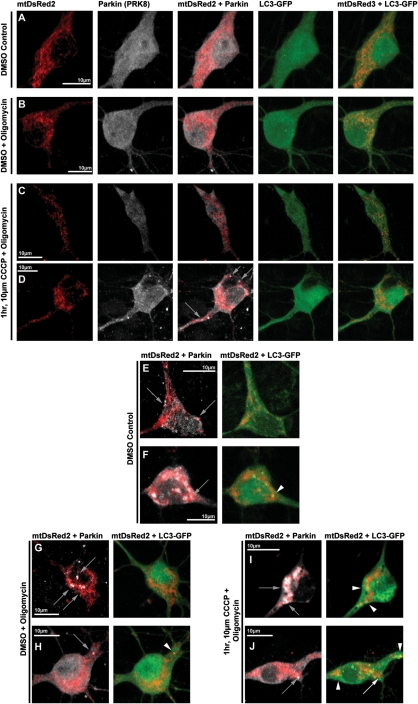
Recent studies delineate a pathway involving familial Parkinson's disease (PD)-related proteins PINK1 and Parkin, in which PINK1-dependent mitochondrial accumulation of Parkin targets depolarized mitochondria towards degradation through mitophagy. The pathway has been primarily characterized in cells less dependent on mitochondria for energy production than neurons. Here we report that in neurons, unlike other cells, mitochondrial depolarization by carbonyl cyanide m-chlorophenyl hydrazone did not induce Parkin translocation to mitochondria or mitophagy. PINK1 overexpression increased basal Parkin accumulation on neuronal mitochondria, but did not sensitize them to depolarization-induced Parkin translocation. Our data suggest that bioenergetic differences between neurons and cultured cell lines contribute to these different responses. In HeLa cells utilizing usual glycolytic metabolism, mitochondrial depolarization robustly triggered Parkin-mitochondrial translocation, but this did not occur in HeLa cells forced into dependence on mitochondrial respiration. Declining ATP levels after mitochondrial depolarization correlated with the absence of induced Parkin-mitochondrial translocation in both HeLa cells and neurons. However, intervention allowing neurons to maintain ATP levels after mitochondrial depolarization only modestly increased Parkin recruitment to mitochondria, without evidence of increased mitophagy. These data suggest that changes in ATP levels are not the sole determinant of the different responses between neurons and other cell types, and imply that additional mechanisms regulate mitophagy in neurons. Since the Parkin-mitophagy pathway is heavily dependent on bioenergetic status, the unique metabolic properties of neurons likely influence the function of this pathway in the pathogenesis of PD.


Figures

Figure 1.
Figure 1.
Parkin localization in cortical neurons after exposure to CCCP. Rat cortical neurons were co-transfected with hu-Parkin and mitochondrially targeted DsRed2 (mtDsRed2) at DIV6, then treated 72 h later with either DMSO vehicle control (A, D, F, I, K) or 10 µm CCCP (B, C, E, G, J, L) for 1 or 6 h. After 6 h of treatment, a majority of cells in both control and CCCP conditions did not exhibit any translocation of Parkin to the mitochondria (A–C). Most cells exposed to CCCP exhibited minor, if any, mitochondrial morphology changes (b), although a minority of cells exhibited excessive fragmentation (C). A baseline population of Parkin-overexpressing cells exhibited Parkin–mitochondrial accumulation (arrowheads) in both (D) control and (E) CCCP treatment conditions. (F) A neuron co-transfected with mtDsRed2, Parkin and LC3-GFP demonstrates that even with excessive Parkin–mitochondrial localization, no increased mitophagy was observed. (G) Another cell exhibits active mitophagy based on LC3-GFP and mtDsRed2 co-localization (grey arrows), but no Parkin–mitochondrial accumulation. (H) Graph of observed percentage of neurons exhibiting Parkin–mitochondrial localization, with no significance between groups (ANOVA) (30–60 individual cells across three to four independent neuronal preps; ± SEM). Like cell bodies, mitochondria in neuritic projections did not exhibit any differences in Parkin or LC3 localization between (I) DMSO control or (J) CCCP treatments. Definite co-localizations were rare events, and primarily observed in blebbing (K) or fragmented (L) neurites, regardless of treatment.
Figure 2.
Figure 2.
Western blot analysis of endogenous Parkin localization in cortical neurons after CCCP exposure. Non-transfected cortical neurons were treated and harvested on DIV9 for differential centrifugation isolation of the mitochondrial-enriched fraction. (A) Western blot from the commercial-reagent-based mitochondrial isolation stained for Parkin (PRK8) and mitochondrial loading control HSP60. (B) Quantitative results from western blot analysis presented as the densitometry ratio of Parkin bands over respective mitochondrial HSP60 loading control bands, as percent DMSO control. No significance between results (ANOVA) (n = 3–4 from three independent neuron preps; ± SEM).
Figure 3.
Figure 3.
Parkin localization in cortical neurons after 24 h expression, Parkin and PINK1 co-expression, and in striatal/midbrain cultures. (A) Rat cortical neurons were co-transfected with hu-Parkin and DsRed2, or hu-Parkin, PINK1-GFP and mtDsRed2 at DIV6, then treated with either DMSO vehicle control, 100 nm CCCP or 10 µm CCCP for 1 or 6 h on DIV7. Graph represents percentage of observed neurons exhibiting Parkin–mitochondrial localization. No significance between results within Parkin groups or within PINK1 + Parkin groups, respectively (ANOVA). * = P < 0.05, significance between Parkin and Parkin + PINK1 DMSO controls at 1 and 6 h, ANOVA with post hoc Student's t-tests with Bonferroni correction (n = 3–4 from three independent neuron preps; ±SEM). (B) Mixed-culture rat striatal and midbrain neurons were transfected at DIV6 and treated at DIV9. Graph represents percentage of observed neurons exhibiting Parkin–mitochondrial localization. No significance between results; z-test of proportions (n = 20–60 cells/condition from two independent neuron preps; ±SEM). (C and D) Representative images from striatal-midbrain neurons treated with Control vehicle DMSO (C) or 10 μm CCCP (D) for 1 h.
Figure 4.
Figure 4.
Parkin localization in naïve SH-SY5Y cells after mitochondrial depolarization. SH-SY5Y cells co-transfected with mtDsRed2 and hu-Parkin were exposed to (A) 1 h DMSO vehicle control or (B) 1 h, 10 µm CCCP. Cells demonstrate dramatic Parkin–mitochondrial colocalization after CCCP treatment. (C) Graph represents percentage of observed cells exhibiting (white) one to two Parkin–mitochondrial colocalizations per cell, (grey) more than two Parkin–mitochondrial colocalizations per cell and (black) non-mitochondrial cellular Parkin accumulations. *P < 0.05 from DMSO control; ANOVA with post hoc Student's t-tests with Bonferroni correction (n = 3; ±SEM). (D) SH-SY5Y cell co-transfected with mtDsRed2, hu-Parkin and LC3-GFP, demonstrating mitophagy via co-localization of LC3-GFP with mtDsRed2 and Parkin (arrowheads).
Figure 5.
Figure 5.
Endogenous and overexpressed Parkin localization in NGF-differentiated PC6-3 cells. PC6-3 cells were neuronally differentiated using NGF, and co-transfected with mtDsRed2 and either (A and B) empty-vector control plasmid or (C and D) hu-Parkin. 96 h after transfection, cells were treated with either (A and C) DMSO vehicle control or (B and D) 1 h, 10 µm CCCP. Both (A and B) endogenous rat Parkin and (C and D) overexpressed hu-Parkin were detected via ICC. Cells demonstrate dramatic Parkin–mitochondrial colocalization after CCCP treatment. (E) Graph represents percentage of observed cells exhibiting Parkin–mitochondrial accumulations. *P < 0.05 and **P < 0.05, significant from respective DMSO controls; z-test of proportions (n = 27–46 cells per condition from two independent platings; ±SEM).
Figure 6.
Figure 6.
Parkin accumulates on depolarized mitochondria in glycolytic, but not oxidative-phosphorylation-dependent HeLa cells. HeLa cells were maintained in either (A and B) glucose-based media or (C and D) glucose-free media supplemented with galactose and glutamine. Cells were co-transfected with mtDsRed2 and hu-Parkin, then treated with either (A and C) DMSO vehicle control or (B and D) 10 µm CCCP for either 1 or 3 h. Cells grown in DMEM containing glucose (B), but not cells grown in galactose/glutamine media (D), exhibit robust Parkin–mitochondrial translocation after 3 h CCCP. (E) Graph represents percentage of observed cells exhibiting Parkin–mitochondrial accumulations. ATP levels were determined in non-transfected HeLa cells after 1 or 3 h of CCCP treatment in both (F) glucose and (G) galactose/glutamine culturing conditions. For all data, *P < 0.05 and **P < 0.05 from respective DMSO controls; ANOVA with post hoc Student's t-tests with Bonferroni correction (n = 3; ±SEM).
Figure 7.
Figure 7.
Effects of oligomycin co-treatment on CCCP-induced ATP loss and Parkin localization in cortical neurons. (A) Non-transfected neurons were treated on DIV10 and collected at the indicated time points for ATP level analysis. *P < 0.05, DMSO control significant from all treatment groups; **P < 0.05, 15 min CCCP + oligomycin significant from 15 min CCCP; ***P < 0.05, 1 h CCCP + oligomycin significant from 1 h CCCP; ANOVA with post hoc Newman–Keuls (n = 6–15; ±SEM). (B) Cortical neurons were co-transfected with mtDsRed2 and hu-Parkin at DIV6, then treated at DIV10 with either DMSO vehicle control or CCCP, or co-treated with 10 µm oligomycin, for 1 h. Graph represents percentage of observed cells exhibiting Parkin–mitochondrial accumulations. *P < 0.05, significant from respective DMSO control; z-test of proportions (n = 28–157 cells per condition, from three to six separate experiments across three to four independent platings; ±SEM).
Figure 8.
Figure 8.
Respresentative images of Parkin and LC3-GFP localization in cortical neurons following oligomycin and CCCP co-treatments. Rat cortical neurons were co-transfected with hu-Parkin, mtDsRed2 and LC3-GFP at DIV6, then treated 96 h later with either DMSO vehicle Control (A, E, F), DMSO with 10 µm oligomycin co-treatment (B, G, H) or 10 µm CCCP with 10 µm oligomycin co-treatment (C, D, I, J) for 1 h. After treatment, a majority of cells in all conditions did not exhibit any translocation of Parkin to the mitochondria (A–C). CCCP-oligomycin co-treatment exhibited a modest but significant increase in the number of cells exhibiting Parkin–mitochondria localization (D), though most positive cells presented with more than five Parkin-positive mitochondria (D, grey arrows). While Parkin–mitochondria localization could also be identified in all conditions (D–J, grey arrows), most cells exhibited no apparent mitophagy, based on LC3-GFP accumulation localization, regardless of Parkin localization (A–E, G). Mitophagy rates did not appear to be affected by oligomycin or CCCP-oligomycin co-treatments, and rare mitophagy events could be identified in all conditions, including Parkin-positive mitophagy (F, H, I; white arrowheads), and mitophagy events independent of Parkin localization (J, white arrow indicates a Parkin-positive mitochondrion without LC3 accumulation; white arrowheads indicate LC3-positive mitochondria without Parkin localization).

References

    1. Beal M.F. Mitochondria and neurodegeneration. Novartis Found. Symp. 2007;287:183–192. discussion 192-186. - PubMed
    1. Schapira A.H. Mitochondria in the aetiology and pathogenesis of Parkinson's disease. Lancet. Neurol. 2008;7:97–109. - PubMed
    1. Chen H., Chan D.C. Mitochondrial dynamics—fusion, fission, movement, and mitophagy—in neurodegenerative diseases. Hum. Mol. Genet. 2009;18:R169–R176. - PMC - PubMed
    1. Knott A.B., Bossy-Wetzel E. Impairing the mitochondrial fission and fusion balance: a new mechanism of neurodegeneration. Ann. N. Y. Acad. Sci. 2008;1147:283–292. - PMC - PubMed
    1. Van Laar V.S., Berman S.B. Mitochondrial dynamics in Parkinson's disease. Exp. Neurol. 2009;218:247–256. - PMC - PubMed

Publication types

MeSH terms