. 2011 Feb 11;286(6):4589-97.
doi: 10.1074/jbc.M110.182162. Epub 2010 Dec 8.

Fatty acid (FFA) transport in cardiomyocytes revealed by imaging unbound FFA is mediated by an FFA pump modulated by the CD36 protein

Affiliations

Fatty acid (FFA) transport in cardiomyocytes revealed by imaging unbound FFA is mediated by an FFA pump modulated by the CD36 protein

Andrew N Carley et al. J Biol Chem. .

Abstract

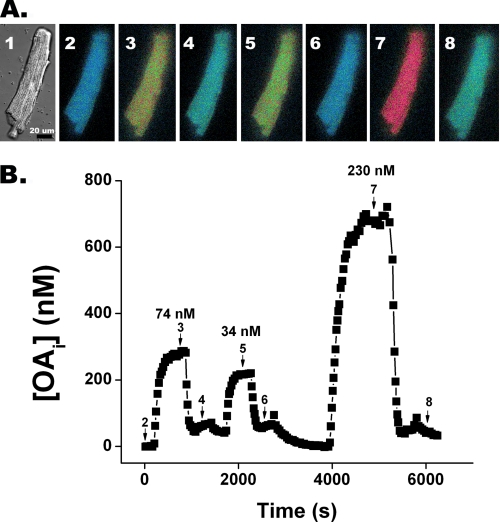
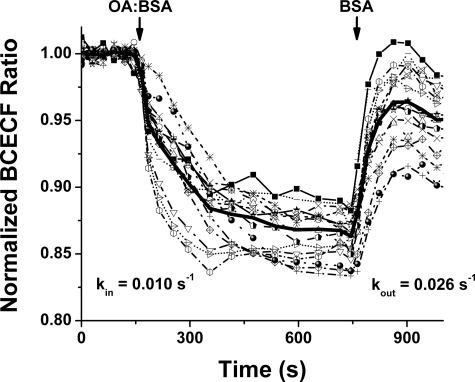
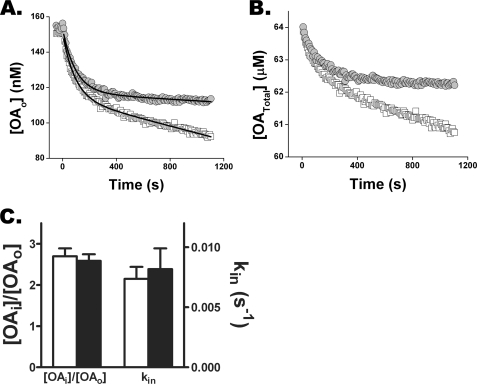
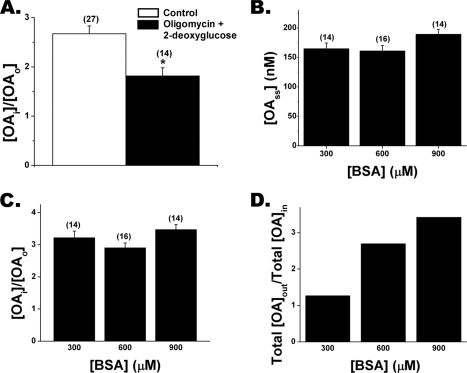
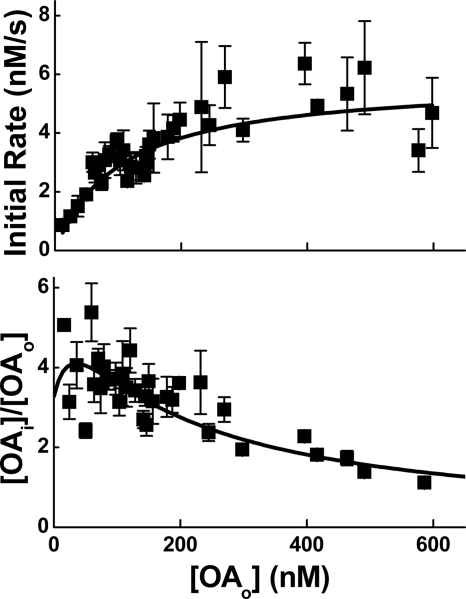
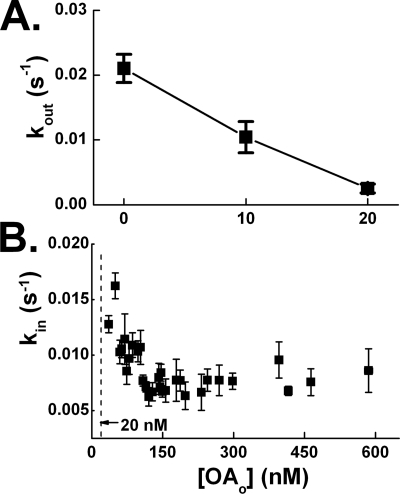
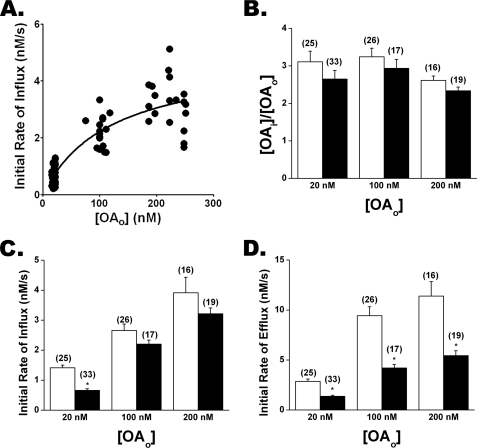
Free fatty acid (FFA) transport across the cardiomyocyte plasma membrane is essential to proper cardiac function, but the role of membrane proteins and FFA metabolism in FFA transport remains unclear. Metabolism is thought to maintain intracellular FFA at low levels, providing the driving force for FFA transport, but intracellular FFA levels have not been measured directly. We report the first measurements of the intracellular unbound FFA concentrations (FFA(i)) in cardiomyocytes. The fluorescent indicator of FFA, ADIFAB (acrylodan-labeled rat intestinal fatty acid-binding protein), was microinjected into isolated cardiomyocytes from wild type (WT) and FAT/CD36 null C57B1/6 mice. Quantitative imaging of ADIFAB fluorescence revealed the time courses of FFA influx and efflux. For WT mice, rate constants for efflux (∼0.02 s(-1)) were twice influx, and steady state FFA(i) were more than 3-fold larger than extracellular unbound FFA (FFA(o)). The concentration gradient and the initial rate of FFA influx saturated with increasing FFA(o). Similar characteristics were observed for oleate, palmitate, and arachidonate. FAT/CD36 null cells revealed similar characteristics, except that efflux was 2-3-fold slower than WT cells. Rate constants determined with intracellular ADIFAB were confirmed by measurements of intracellular pH. FFA uptake by suspensions of cardiomyocytes determined by monitoring FFA(o) using extracellular ADIFAB confirmed the influx rate constants determined from FFA(i) measurements and demonstrated that rates of FFA transport and etomoxir-sensitive metabolism are regulated independently. We conclude that FFA influx in cardiac myocytes is mediated by a membrane pump whose transport rate constants may be modulated by FAT/CD36.


Figures

FIGURE 1.
FIGURE 1.
FFA transport in a cardiomyocyte monitored by quantitative imaging of intracellular unbound oleate. A, differential interference contrast and ratio fluorescence images of a cardiomyocyte microinjected with ADIFAB at different times after changing OAo is shown. Panel 1 is a differential contrast image of a typical cardiomyocyte after ADIFAB microinjection. Panels 2–8 are ADIFAB fluorescence ratio (505/432 nm) images represented in “false color” in which blue corresponds to low and red to high OAi, acquired at select times during three transport cycles (numbered arrows indicate where during the time course shown in B the images were acquired). Panel 2 represents OAi at time 0 when OAo = 0. At 100 s OAo was increased to 74 nm, and panel 3 is at steady state after ∼350 s. After ∼1000 s the media was replaced so that OAo was clamped at 0 nm and OAi returned to base line (panel 4). Panels 5–8 represent the corresponding images for cycles 2 and 3. B, quantitation of complete time courses for the three cycles were determined by whole cell averaging of OAi. OAo for each cycle is indicated above the steady state levels.
FIGURE 2.
FIGURE 2.
Oleate transport cycle measured in BCECF-AM-loaded WT cardiomyocytes. Oleate transport was measured by the change in pHi as determined from the fluorescence responses in 18 BCECF-AM-loaded cardiomyocytes. Time courses are shown for individual cells and the average of all cells (bold line). Cells were initially clamped at OAo = 0 nm. At ∼200 s an OA-BSA complex was added with OAo = 250 nm, leading to a decrease in pHi that decayed with kin = 0.0096 s−1. At ∼750 s OAo was again clamped to 0, resulting in a increase in pHi with kout = 0.026 s−1.
FIGURE 3.
FIGURE 3.
Monitoring FFA uptake differentiates transport from metabolism in cardiomyocytes. Cardiomyocytes (4.2 × 10⁴) were added to a stirred cuvette containing a weakly buffered OA-BSA complex (BSA = 10 μm) and 0.2 μm ADIFAB. The ratio of 505 and 432-nm fluorescence intensities was measured every 8 s, from which OAo values were computed as described (15). A, comparison of oleate uptake by cardiomyocytes untreated (open boxes) and treated (filled circles) with 10 μm etomoxir for 15 min is shown. For the first component of uptake, the rate constants 0.011 and 0.010 s−1 and the decrease in OAo, 33.1 and 32.9 nm, were virtually identical for control and etomoxir treated cardiomyocytes. In contrast, the slope of the linear component decreased 5-fold, from 0.02 to 0.004 nm/s for etomoxir-treated cells. B, uptake data of A, represented as [OATotal], was calculated using Equation 2. C, etomoxir treatment (filled bars) of microinjected cardiomyocytes does not affect OAi or kin for well buffered OAo (600 μm BSA). Results are from four etomoxir-treated and untreated cells.
FIGURE 4.
FIGURE 4.
Oligomycin plus 2-deoxyglucose treatment decreases FFAi/FFAo. A, treatment of cardiomyocytes with 10 μg/ml oligomycin and 37 mm 2-deoxyglucose for 30 min reduced the gradient in cardiomyocytes. B, steady state FFAi is independent of total extracellular FFA as demonstrated using OA-BSA complexes of 300, 600, and 900 μm BSA with total FFA adjusted so that OAo ∼ 50 nm for each complex. The number of cells investigated in each case is shown in parentheses. Results from B were used to determine the FFAu gradient (C) and total FFA gradient (D) as a function of BSA concentration. D, total FFA gradients were calculated using Equation 3 and data from B.
FIGURE 5.
FIGURE 5.
FFA transport reveals saturation with increasing FFAo. Upper panel, the initial rate of influx as a function of increasing OAo is shown. Lower panel, shown is the concentration gradient OAi/OAo, also as a function of increasing OAo. Results for both panels were obtained from 154 transport cycles using cells derived from hearts isolated from 14 C57BL/6 mice. Five transport cycles were used per data point. Results of both panels were well described (R2 = 0.85) by a carrier model (solid lines) with maximum velocity Rmax ∼ 6 nm/s and a dissociation constant for binding to the extracellular face of the carrier Ko ∼ 100 nm.
FIGURE 6.
FIGURE 6.
Efflux and influx rate constants decrease with increasing FFAo in cardiomyocytes. A, efflux rate constants were measured after initiating influx by exposing cardiomyocytes to OAo = 150 nm. Cells were allowed to reach steady state, at which time OAi was ∼500 nm. At that point the extracellular buffer containing OAo = 150 nm was exchanged for a buffer in which OAo was clamped at concentrations of 0, 10, and 20 nm, and kout was determined. Data were obtained from three cells exposed to the same complexes. B, influx rate constants (kin) were determined for increasing OAo. Data were obtained from 154 transport cycles derived from cardiomyocytes isolated from the hearts of 14 mice. An average of five transport cycles per data point is shown.
FIGURE 7.
FIGURE 7.
Oleate transport in FAT/CD36−/− and WT cardiomyocytes. A, initial rates of influx versus the OAo for FAT/CD36−/− cardiomyocytes were well described by the carrier model (R2 = 0.78) with Rmax ∼ 5 nm/s and Ko ∼ 120 nm. The data were significantly nonlinear (p = 0.045). B, OAi/OAo gradients for WT (white) and FAT/CD36−/− (black) cardiomyocytes for increasing OAo are shown. C, initial rates of influx are shown. D, initial rates of efflux are shown. Averages of N transport cycles are indicated in parentheses.

References

    1. Szczepaniak L. S., Victor R. G., Orci L., Unger R. H. (2007) Circ. Res. 101, 759–767 - PubMed
    1. Kampf J. P., Kleinfeld A. M. (2007) Physiology 22, 7–14 - PubMed
    1. Bonen A., Chabowski A., Luiken J. J., Glatz J. F. (2007) Physiology 22, 15–29 - PubMed
    1. Hamilton J. A. (2007) Prostaglandins Leukot. Essent. Fatty Acids 77, 355–361 - PubMed
    1. Ibrahimi A., Abumrad N. A. (2002) Curr. Opin. Clin. Nutr. Metab Care 5, 139–145 - PubMed

Publication types

MeSH terms