. 2011 Feb 25;286(8):6233-40.
doi: 10.1074/jbc.M110.179184. Epub 2010 Dec 8.

Small molecule inhibitors that selectively block dengue virus methyltransferase

Affiliations

Small molecule inhibitors that selectively block dengue virus methyltransferase

Siew Pheng Lim et al. J Biol Chem. .

Abstract

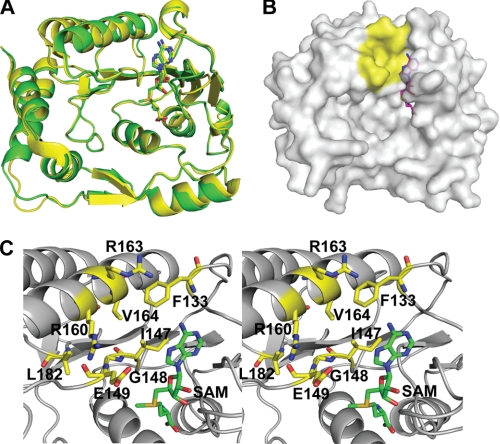
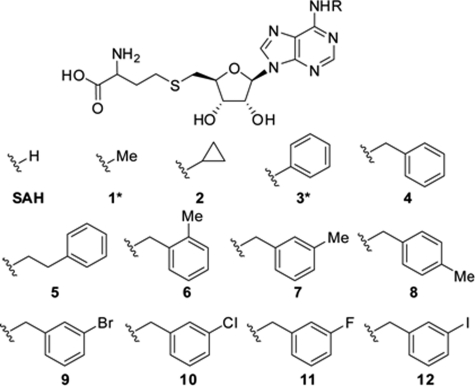
Crystal structure analysis of Flavivirus methyltransferases uncovered a flavivirus-conserved cavity located next to the binding site for its cofactor, S-adenosyl-methionine (SAM). Chemical derivatization of S-adenosyl-homocysteine (SAH), the product inhibitor of the methylation reaction, with substituents that extend into the identified cavity, generated inhibitors that showed improved and selective activity against dengue virus methyltransferase (MTase), but not related human enzymes. Crystal structure of dengue virus MTase with a bound SAH derivative revealed that its N6-substituent bound in this cavity and induced conformation changes in residues lining the pocket. These findings demonstrate that one of the major hurdles for the development of methyltransferase-based therapeutics, namely selectivity for disease-related methyltransferases, can be overcome.


Figures

FIGURE 1.
FIGURE 1.
A cavity in DENV MTase. A, superposition of the crystal structures of the DENV-3 MTase-SAM complex (yellow) and the DENV-2 MTase-SAH complex (green; PDB code: 1L9K (2)). SAM and SAH are shown in stick representation. B, surface representation of the DENV-3 MTase. The additional cavity adjacent to the adenine of the SAM molecule is colored in yellow. The MTase protein was set to partial transparency to view the complete molecule of SAM. SAM is shown as stick representation. C, stereo view of amino acids involved in the formation of the additional cavity. Residues and the SAM molecule are labeled and shown in stick representation. The images were produced using PyMOL.
FIGURE 2.
FIGURE 2.
Functional analysis of the identified cavity in DENV-2 replication. A, immunofluorescence analysis (IFA). BHK-21 cells were electroporated with WT and mutant genome-length RNAs. The mutant genome-length RNAs contained Ala substitution at indicated positions. At various time points post-transfection (p.t.), the cells were subjected to IFA using mouse antibody 4G2 (against DENV E protein) and anti-mouse immunoglobulin G conjugated with FITC (green) as the primary and secondary antibodies, respectively. Nuclei were counterstained with DAPI in blue. B, plaque morphology of WT and mutant viruses from supernatants collected from Vero cells after 5 days post-infection. C, growth kinetics WT and mutant viruses. Vero cells were infected with the indicated viruses at an MOI of 0.1. Culture fluids of the infected cells were determined for viral titers using plaque assay. Note the scale of viral titer from 0 to 102 PFU/ml is different from the scale of 102 to 108 PFU/ml.
FIGURE 3.
FIGURE 3.
Structures of SAH derivatives that inhibit DENV-3 MTase.
FIGURE 4.
FIGURE 4.
Co-crystal structures of DENV-3 MTase in complex with compound 10*. A, superposition of the crystal structures of compound 10*-DENV-3 MTase (green) complex and the MTase-SAM complex (yellow). SAM is shown in stick representation. Compound 10* is colored in magenta. B, surface representation of the DENV-3 MTase, showing the binding of compound 10* (in stick presentation) in the identified cavity. C, representative omit (FoFc) electron density map (green) at a level of 2.5 σ showing the bound compound 10* molecule. Amino acids Phe-133 and Arg-163 are labeled. D, compound-induced conformational change of amino acids. Compound 10* is shown in stick presentation (magenta). Residues Phe-133 and Arg-163 in the SAM-MTase complex are colored in yellow; the same residues in the compound 10*-MTase complex are shown in green; two arrows (red) indicate the compound-induced conformational change. E, schematic view of the interactions between compound 10* (brown) and the DENV-3 MTase (black).

References

    1. Copeland R. A., Solomon M. E., Richon V. M. (2009) Nat. Rev. Drug Discov. 8, 724–732 - PubMed
    1. Egloff M. P., Benarroch D., Selisko B., Romette J. L., Canard B. (2002) EMBO J. 21, 2757–2768 - PMC - PubMed
    1. Ray D., Shah A., Tilgner M., Guo Y., Zhao Y., Dong H., Deas T., Zhou Y., Li H., Shi P. Y. (2006) J. Virol. 80, 8362–8370 - PMC - PubMed
    1. Dong H., Chang D. C., Xie X., Toh Y. X., Chung K. Y., Zou G., Lescar J., Lim S. P., Shi P. Y. (2010) Virology 405, 568–578 - PubMed
    1. Kroschewski H., Lim S. P., Butcher R. E., Yap T. L., Lescar J., Wright P. J., Vasudevan S. G., Davidson A. D. (2008) J. Biol. Chem. 283, 19410–19421 - PubMed

Publication types

MeSH terms

LinkOut - more resources