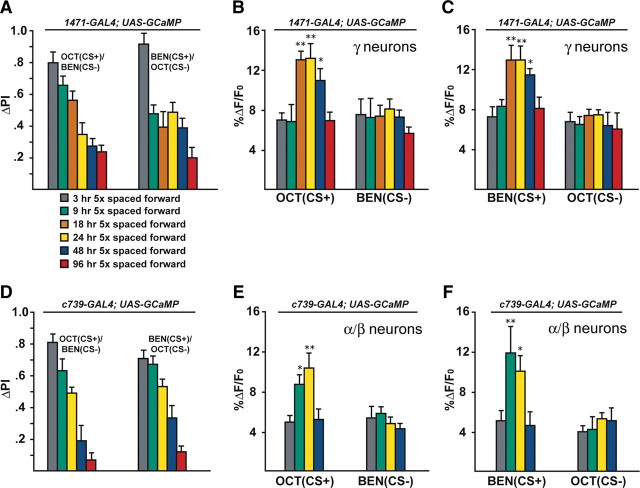
. 2010 Dec 8;30(49):16699-708.
doi: 10.1523/JNEUROSCI.1882-10.2010.

A late-phase, long-term memory trace forms in the γ neurons of Drosophila mushroom bodies after olfactory classical conditioning

Affiliations

A late-phase, long-term memory trace forms in the γ neurons of Drosophila mushroom bodies after olfactory classical conditioning

David-Benjamin G Akalal et al. J Neurosci. .

Abstract

Using functional optical imaging in vivo, we demonstrate that the γ mushroom body (MB) neurons of Drosophila melanogaster respond with axonal calcium influx when odors or electric shock stimuli are presented to the fly. Pairing of odor and electric shock stimuli in a single training trial or multiple, massed training trials failed to modify the odor-evoked calcium signal when flies were tested at several different times after training. In contrast, animals that received multiple but spaced odor-shock pairings exhibited a robust increase in calcium influx into the MB axons when tested between 18 and 48 h after training. This time window for the γ neuron memory trace is displaced relative to the modifications that occur between 9 and 24 h after training in the α branch of the α/β MB neurons. The α/β and the γ neuron long-term memory traces were both blocked by expressing a repressor of the transcription factor cAMP response element-binding protein or a calcium/calmodulin-dependent kinase II hairpin RNA. These results demonstrate that behavioral long-term olfactory memory is encoded as modifications of calcium influx into distinct MB neurons during overlapping but different windows of time after training.


Figures

Figure 1.
Figure 1.
The γ mushroom body neurons respond with calcium influx into their axons when odors or electric shock stimuli are delivered to Drosophila. A, Representative time course for the fluorescence response to the odor Oct or Ben in the axons of γ MB neurons. The response was calculated as the percentage increase in fluorescence over baseline (%ΔF/F0) as a function of time. For subsequent bar graphs, the %ΔF/F0 was calculated as the percentage difference between the maximum average intensity over five successive imaging frames during the 3 s odor application and the average intensity over five successive frames just before odor application. Representative images are shown (n = 6–7). B, Images of the basal fluorescence of Uas–G-CaMP expressed with 1471–Gal4 in the axons of γ MB neurons (left column). The change in fluorescence (%ΔF/F0), calculated as the percentage change in fluorescence (ΔF) relative to baseline (F0) that occurs after exposure to Ben or Oct, is illustrated as a false color image to the right of each panel showing the basal fluorescence. Each pseudocolor image shown here and in other figures is a single-frame snapshot of the response during stimulation. Because the spatial response pattern fluctuates between frames during the stimulation on a pixel-by-pixel basis, the group data (C) better represent the average peak response across the flies that were imaged. Representative images are shown (n = 6–7). C, The amplitude of the response to odor from group data for the axons of γ MB neurons (n = 6–7) is illustrated. The ratio ΔF/F0 was typically between 6 and 7% and proved to be statistically significant (p ≤ 0.0277, Wilcoxon's matched-pairs tests) compared with zero for both odors. Error bars are the SEM. D, Images of the basal fluorescence of Uas–G-CaMP expressed with 1471–Gal4 in the axon branches of γ MB neurons (left). The response (%ΔF/F0) of the axon branches to 90 V electric shock pulses is illustrated as a false color image in the right. Representative images are shown (n = 6–7). E, Calcium influx into the axons of γ MB neurons that occurs with 90 V, 1.25 s electric shock pulses every 5 s. The traces represent the average %ΔF/F0 across the region of interest in the axons of γ MB neurons. An obvious calcium response was observed, with each shock pulse riding on top of a decaying background attributable to bleaching over a 60 s scanning period.
Figure 2.
Figure 2.
Conditioning protocols: spaced conditioning produces robust 24 h long-term memory. A, Diagram illustrating the conditioning protocols that were used for these experiments. Flies carried one copy of 1471–Gal4 and one copy of Uas–G-CaMP. Naive flies were carried through the same procedures as the conditioned animals except that they were not exposed to odor and electric shock. For 1× training, flies received forward or backward conditioning (45 s offset) with 1 min exposure to the CS+ odor with 12 electric shock pulses (90 V), followed by 1 min exposure to the CS− odor without electric shock. The CS− odor was applied after a 30 s exposure to fresh air. For massed and spaced conditioning, the 1× training protocol was performed a total of five times with either a 0 or 15 min intertrial interval (ITI), respectively. Flies were transferred to a T-maze at 24 h after conditioning and tested for behavioral memory. Some flies were separated before behavioral testing and analyzed for cellular memory by functional imaging. B, The performance gains of flies carrying 1471–Gal4 and Uas–G-CaMP that were trained to associate Oct or Ben as the CS+ are shown. The ΔPI was computed by subtracting the scores of each naive group from the corresponding conditioned group. In all cases, the scores of naive animals were not statistically significant (Wilcoxon's matched-pairs tests) from zero (p ≥ 0.4953, n = 10–12). For Oct (CS+) versus Ben (CS−) with 1471–Gal4; Uas–G-CaMP flies, 5× spaced forward training had a significant effect when compared with the ΔPI scores for all the backward trained groups (Kruskal–Wallis statistic of 18.041, p = 0.0029; Mann–Whitney pairwise comparisons, p ≤ 0.0001; n = 10–18 for all groups). None of the ΔPI scores of the backward trained groups were statistically significant (Wilcoxon's matched-pairs tests) from zero (p ≥ 0.1258; n = 10–12 for all groups). For Ben (CS+) versus Oct (CS−), 5× spaced forward training had a significant effect when compared with the ΔPI scores for all of the backward trained groups (Kruskal–Wallis statistic of 28.105, p < 0.0001; Mann–Whitney pairwise comparisons, p ≤ 0.0001), as well as 1× forward and 5× massed forward groups (p ≤ 0.0009, Mann–Whitney pairwise comparisons, n = 10–18 for all groups). None of the ΔPI scores of the backward trained groups were statistically significant (Wilcoxon's matched-pairs tests) from zero (p ≥ 0.1466; n = 10–12 for all groups). In all behavioral experiments, the ΔPIs were subjected to nonparametric tests, i.e., a Mann–Whitney U test for comparing two independent samples, Wilcoxon's matched-pairs test to test single performance indices against zero, and Kruskal–Wallis test for multiple comparisons with genotype as the main effect. Error bars are the SEM. **p < 0.01.
Figure 3.
Figure 3.
A long-term memory trace forms in the axons of the γ MB neurons after spaced forward conditioning. A, Response to the CS+ and CS− odors 24 h after conditioning. A significant increase in %ΔF/F0 was detected in the axons of γ MB neurons using Oct as the test stimulus after 5× spaced forward conditioning with Oct as the CS+ and Ben as the CS− compared with any other group (Kruskal–Wallis statistic of 25.561, p = 0.0009; Mann–Whitney pairwise comparisons, p ≤ 0.011). The response magnitudes for all other groups (1× forward and backward, 5× massed forward and backward, and 5× spaced backward) were similar to each other and naive animals presented with odor (see Fig. 1C) (Kruskal–Wallis statistic of 2.557, p = 0.7679; Mann–Whitney pairwise comparisons, p ≥ 0.1069). No significant differences in the %ΔF/F0 response to the CS− (Ben) were detected among any of the conditioned groups (Kruskal–Wallis statistic of 3.11, p = 0.6831; Mann–Whitney pairwise comparisons, p ≥ 0.1926; n = 12–20 for all groups). Error bars are the SEM. **p < 0.01. B, Group time course for the response to the CS+ of Oct in the axons of γ MB neurons after spaced forward conditioning compared with spaced backward conditioning. The graph was made using the data from the same flies used for the bar graph in A. Error bars are the SEM. C, Calcium responses in the axons of γ MB neurons in animals conditioned with Ben as the CS+ and Oct as the CS−. A significant increase in %ΔF/F0 was detected in the axons of γ MB neurons using Ben as the test stimulus after 5× spaced forward conditioning with Ben as the CS+ and Oct as the CS− compared with any other group (Kruskal–Wallis statistic of 18.02, p = 0.0029; Mann–Whitney pairwise comparisons, p ≤ 0.0045). The response magnitudes for all other groups (1× forward and backward, 5× massed forward and backward, and 5× spaced backward) were similar to each other and naive animals presented with odor (see Fig. 1C) (Kruskal–Wallis statistic of 3.799, p = 0.5787; Mann–Whitney pairwise comparisons, p ≥ 0.3284). No significant differences in the %ΔF/F0 response to the CS− (Oct) were detected among any of the conditioned groups (Kruskal–Wallis statistic of 7.599, p = 0.1798; Mann–Whitney pairwise comparisons, p ≥ 0.0914), except for the response between the 5× massed forward and 5× spaced forward (Mann–Whitney test, p = 0.0346). n = 8–11 for all groups. Error bars are the SEM. ***p < 0.0001. D, Images of the basal fluorescence of Uas–G-CaMP expressed with 1471–Gal4 in the axons of γ MB neurons (left column). The change in fluorescence (%ΔF/F0) that occurs after exposure to the CS+ or CS− odor is illustrated as a false color image (middle and right columns, respectively). A robust increase in calcium influx was detected in the γ axons after CS+ odor stimulation 24 h after 5× spaced forward conditioning for both odor combinations, whereas the calcium responses to the CS+ after spaced backward conditioning and to the CS− for both spaced forward and spaced backward conditioning was similar to the odor responses of naive animals.
Figure 4.
Figure 4.
The memory trace in the axons of γ MB neurons forms between 9 and 18 h and persists until 48 h after spaced forward conditioning. A, Time course for long-term memory of flies carrying 1471–Gal4 and Uas–G-CaMP. Memory after spaced forward conditioning decreases with time. Flies were trained using the 5× spaced forward conditioning protocol with Oct (CS+) versus Ben (CS−) and Ben (CS+) versus Oct (CS−) and tested 3, 9, 18, 24, 48, and 96 h later for behavioral memory (ΔPI). For Oct (CS+), the performance of the flies gradually decreased with time (Kruskal–Wallis statistic of 38.215, p < 0.0001), and flies tested at 3 and 9 h performed significantly better than flies tested at 24, 48, and 96 h (Mann–Whitney pairwise comparisons, p ≤ 0.0047). Flies tested at 18 h demonstrated significantly higher performance scores compared with flies tested at 48 and 96 h (Mann–Whitney pairwise comparisons, p ≤ 0.0179). For Ben (CS+), flies tested at 3 h performed significantly better than all other time points (Kruskal–Wallis statistic of 26.776, p < 0.0001; Mann–Whitney pairwise comparisons, p ≤ 0.0024). The PI scores for flies tested at the other time points were not significantly different from each other (Mann–Whitney pairwise comparisons, p ≥ 0.0865), except that the PI score for flies tested at 96 h was significantly different from 9 and 24 h (Mann–Whitney pairwise comparisons, p ≤ 0.0084; n = 10–12 for all groups). Error bars are the SEM. B, Time course for the cellular memory trace in the axons of the γ MB neurons with Oct (CS+). There was a significant increase in the measured calcium transients (%ΔF/F0) in response to the CS+ (Oct) at 18, 24, and 48 h after spaced forward conditioning compared with 3, 9, and 96 h (Kruskal–Wallis statistic of 22.504, p = 0.0004; Mann–Whitney pairwise comparisons, p ≤ 0.0233). There were no significant differences among the 18, 24, and 48 time points (Kruskal–Wallis statistic of 0.234, p = 0.8894; Mann–Whitney pairwise comparisons, p ≥ 0.0741) or the 3, 9, and 96 h time points (Kruskal–Wallis statistic of 0.611, p = 0.7368; Mann–Whitney pairwise comparisons, p ≥ 0.5078). There were no significant differences in response to the CS− (Ben) among any of the time points (Kruskal–Wallis statistic of 2.159, p = 0.8268; Mann–Whitney pairwise comparisons, p ≥ 0.0715; n = 8–20 for all groups). Error bars are the SEM. *p < 0.05, **p < 0.01. C, Time course for the cellular memory trace in the axons of the γ MB neurons with Ben (CS+). There was a significant increase in the measured calcium transients (%ΔF/F0) in response to the CS+ (Ben) in the axons of the γ MB neurons at 18, 24, and 48 h after spaced forward conditioning compared with 3, 9, and 96 h (Kruskal–Wallis statistic of 23.247, p = 0.0003; Mann–Whitney pairwise comparisons, p ≤ 0.0318) except for the response at 48 and 96 h (Mann–Whitney test, p = 0.0723). There were no significant differences among the18, 24, and 48 h time points (Kruskal–Wallis statistic of 1.394, p = 0.498; Mann–Whitney pairwise comparisons, p ≥ 0.3181) or the 3, 9, and 96 h time points (Kruskal–Wallis statistic of 0.479, p = 0.7870; Mann–Whitney pairwise comparisons, p ≥ 0.4328). There were no significant differences in response to the CS− (Ben) among any time point (Kruskal–Wallis statistic of 4.431, p = 0.4891; Mann–Whitney pairwise comparisons, p ≥ 0.1546; n = 8–15 for all groups). Error bars are the SEM. *p < 0.05, **p < 0.01. D, Time course of long-term memory for flies carrying c739–Gal4 and Uas–G-CaMP. Memory after spaced forward conditioning decreases with time. Flies were trained using the 5× spaced forward conditioning protocol with Oct (CS+) versus Ben (CS−) and Ben (CS+) versus Oct (CS−) and tested at different time points for behavioral memory (ΔPI). For Oct (CS+), the performance of the flies gradually decreased with time (Kruskal–Wallis statistic of 37.828, p < 0.0001), and all pairwise comparisons were significantly different from one another (Mann–Whitney test, p ≤ 0.0479) except for the 3 vs 9 h and 48 vs 96 h PI values (Mann–Whitney test, p ≥ 0.0647). Similarly, for Ben (CS+), the performance of the flies gradually decreased with time (Kruskal–Wallis statistic of 34.018, p < 0.0001), and all pairwise comparisons were significantly different from one another (Mann–Whitney test, p ≤ 0.0433) except for the performance at 9 h, which was not significantly different from 3 and 24 h (Mann–Whitney test, p ≥ 0.0865; n = 10–12 for all groups). Error bars are the SEM. E, Time course for the cellular memory trace in the α branch of the α/β MB neurons with Oct (CS+). There was significant increment in the measured calcium transients (%ΔF/F0) in response to Oct (CS+) at 9 and 24 h after spaced conditioning compared with 3 and 48 h (Kruskal–Wallis statistic of 16.312, p = 0.0010; Mann–Whitney pairwise comparisons, p ≤ 0.0138). There was no significant difference between the 9 and 24 h time points (Mann–Whitney pairwise comparisons, p = 0.3823) or the 3 and 48 h time points (Mann–Whitney pairwise comparisons, p = 0.902). In addition, there were no significant differences in response to the CS− among the different time points (Kruskal–Wallis statistic of 2.595, p = 0.4583; Mann–Whitney pairwise comparisons, p ≥ 0.0743). Data for 3, 9, and 24 h time points are reproduced from Yu et al. (2006). n = 9–12 for all groups. Error bars are the SEM. *p < 0.05, **p < 0.01. F, Time course for the cellular memory trace in the α branch of the α/β MB neurons with Ben (CS+). There was significant increase in the measured calcium transients (%ΔF/F0) in response to the CS+ (Ben) at 9 and 24 h after spaced conditioning training compared with 3 and 48 h (Kruskal–Wallis statistic of 14.378, p = 0.0024; Mann–Whitney pairwise comparisons, p ≤ 0.0128). There was no significant difference between the 9 and 24 h time point (Mann–Whitney test, p = 0.4469) or between the 3 and 48 h time points (Mann–Whitney test, p = 0.7913). In addition, there were no significant differences in response to the CS− among the different time points (Kruskal–Wallis statistic of 2.365, p = 0.5002; Mann–Whitney pairwise comparisons, p ≥ 0.1604). Data for the 24 h time point are reproduced from Yu et al. (2006). n = 7–12 for all groups. Error bars are the SEM. *p < 0.05, **p < 0.01.
Figure 5.
Figure 5.
The long-term memory trace in the axons of γ MB neurons is disrupted by expression of a Creb repressor and a CaMKII hairpin RNA. A, Expression of dCreb2-b or CaMKII hairpin RNA in neurons defined by 1471–Gal4 impairs long-term behavioral memory after spaced forward conditioning. Flies carrying Uas–dCreb2-b, Uas–G-CaMP, and 1471–Gal4 showed significantly reduced performance scores for both Oct (CS+) and Ben (CS+) compared with control flies carrying only Uas–G-CaMP and 1471–Gal4 (Mann–Whitney pairwise comparisons, p ≤ 0.0209). Similarly, flies carrying Uas–CaMKIIhpn, Uas–G-CaMP, and 1471–Gal4 showed significantly reduced performance scores for both odorants as the CS+ compared with the control flies (Mann–Whitney pairwise comparisons, p ≤ 0.0047; n = 12 for all groups). Error bars are the SEM. *p < 0.05. B, There was a significant difference in the measured calcium trace (%ΔF/F0) in response to Oct (CS+) 24 h after spaced forward conditioning between flies carrying only the expressed reporter (1471–Gal4; Uas–G-CaMP) and flies that carried the expressed reporter along with Uas–dCreb2-b or Uas–CaMKIIhpn (Kruskal–Wallis statistic of 16.401, p = 0.0003; Mann–Whitney pairwise comparisons, p ≤ 0.0057). There was no significant difference in response to the CS− among the genotypes (Kruskal–Wallis statistic of 2.856, p = 0.2398; Mann–Whitney pairwise comparisons, p ≥ 0.1391; n = 12–20 for all groups). Error bars are the SEM. **p < 0.01. C, There was a significant difference in the measured calcium trace (%ΔF/F0) in response to the CS+ (Ben) 24 h after spaced forward conditioning between flies carrying only the expressed reporter (1471–Gal4; Uas–G-CaMP) and flies that carried the expressed reporter along with Uas–dCreb2-b or Uas–CaMKIIhpn (Kruskal–Wallis statistic of 15.252, p = 0.0005; Mann–Whitney pairwise comparisons, p ≤ 0.0082). There was no significant difference in response to the CS− among the genotypes (Kruskal–Wallis statistic of 2.279, p = 0.3199; Mann–Whitney pairwise comparisons, p ≥ 0.1872; n = 10–12 for all groups). Error bars are the SEM. **p < 0.01. D, Expression of CaMKII hairpin RNA in neurons defined by c739–Gal4 results in the abolishment of long-term behavioral memory after spaced forward conditioning. Flies carrying Uas–CaMKIIhpn, Uas–G-CaMP, and c739–Gal4 showed significantly reduced performance scores for both Oct (CS+) and Ben (CS+) compared with control flies that carry only Uas–G-CaMP and c739–Gal4 (Mann–Whitney pairwise comparisons, p ≤ 0.0105; n = 6–12 for all groups). Error bars are the SEM. *p < 0.05, **p < 0.01. E, There was a significant difference in the measured calcium trace (%ΔF/F0) in response to the CS+ (Oct) 24 h after spaced forward conditioning between flies carrying only the expressed reporter (c739–Gal4; Uas–G-CaMP) and flies that carried the expressed reporter along with Uas–CaMKIIhpn (Mann–Whitney test, p = 0.0003). There was no significant difference in response to the CS− among the genotypes (Mann–Whitney test, p = 0.1914; n = 10–12 for all groups). Error bars are the SEM. **p < 0.01. F, There was a significant difference in the measured calcium trace (%ΔF/F0) in response to the CS+ (Ben) 24 h after spaced forward conditioning between flies carrying only the expressed reporter (c739–Gal4; Uas–G-CaMP) and flies that carried the expressed reporter along with Uas–CaMKIIhpn (Mann–Whitney test, p = 0.021). There was no significant difference in response to the CS− among the genotypes (Mann–Whitney test, p = 0.7416; n = 9–10 for all groups). Error bars are the SEM. **p < 0.01. G, Expression of dCreb2-b or CaMKII hairpin RNA in neurons defined by c739–Gal4 did not significantly impair 24 h behavioral memory after massed forward conditioning (Kruskal–Wallis statistic of 0.389 for Oct as the CS+ and 3.922 for Ben as the CS+; both <5.99). Flies carrying Uas–CaMKIIhpn, Uas–G-CaMP, and c739–Gal4 showed performance scores that were indistinguishable from control flies carrying only Uas–G-CaMP and c739–Gal4 for both odorants as the CS+ (Mann–Whitney pairwise comparisons, p ≥ 0.6033). Similarly, flies carrying Uas–dCreb2-b, Uas–G-CaMP, and c739–Gal4 showed performance scores for both Oct (CS+) and Ben (CS+) that were not significantly different from control flies (Mann–Whitney pairwise comparisons, p ≥ 0.0764; n = 12–18 for all groups). Error bars are the SEM. H, Expression of dCreb2-b or CaMKII hairpin RNA in neurons defined by 1471–Gal4 did not significantly impair 24 h behavioral memory after massed forward conditioning (Kruskal–Wallis statistic of 0.902 for Oct as the CS+ and 1.257 for Ben as the CS+; both <5.99). Flies carrying Uas–CaMKIIhpn, Uas–G-CaMP, and 1471–Gal4 showed performance scores that were indistinguishable from control flies carrying only Uas–G-CaMP and 1471–Gal4 for both odorants as the CS+ (Mann–Whitney pairwise comparisons, p ≥ 0.3865). Similarly, flies carrying Uas–dCreb2-b, Uas–G-CaMP, and 1471–Gal4 showed performance scores for both CS+ odors that were not significantly different from control flies (Mann–Whitney pairwise comparisons, p ≥ 0.2727; n = 12–18 for all groups). Error bars are the SEM. I, Three minute performance scores after 1× forward conditioning of flies expressing the dCreb2-b repressor or CaMKII hairpin RNA in combination with G-CaMP using 1471–Gal4 and c739–Gal4 were not significantly different from wild-type flies [w(CS10)] (Mann–Whitney pairwise comparisons, p ≥ 0.3367; n = 6–12 for all groups). Error bars are the SEM.

References

    1. Akalal DB, Wilson CF, Zong L, Tanaka NK, Ito K, Davis RL. Roles for Drosophila mushroom body neurons in olfactory learning and memory. Learn Mem. 2006;13:659–668. - PMC - PubMed
    1. Ashraf SI, McLoon AL, Sclarsic SM, Kunes S. Synaptic protein synthesis associated with memory is regulated by the RISC pathway in Drosophila. Cell. 2006;124:191–205. - PubMed
    1. Aso Y, Grübel K, Busch S, Friedrich AB, Siwanowicz I, Tanimoto H. The mushroom body of adult Drosophila characterized by Gal4 drivers. J Neurogenet. 2009;23:156–172. - PubMed
    1. Balschun D, Wolfer DP, Gass P, Mantamadiotis T, Welzl H, Schütz G, Frey JU, Lipp HP. Does cAMP response element-binding protein have a pivotal role in hippocampal synaptic plasticity and hippocampus-dependent memory? J Neurosci. 2003;23:6304–6314. - PMC - PubMed
    1. Beck CD, Schroeder B, Davis RL. Learning performance of Drosophila after repeated conditioning trials with discrete stimuli. J Neurosci. 2000;20:2944–2953. - PMC - PubMed

Publication types

MeSH terms

Substances

LinkOut - more resources