. 2011 Mar;52(3):480-8.
doi: 10.1194/jlr.M011338. Epub 2010 Dec 9.

Mast cells, macrophages, and crown-like structures distinguish subcutaneous from visceral fat in mice

Affiliations

Mast cells, macrophages, and crown-like structures distinguish subcutaneous from visceral fat in mice

Mehmet M Altintas et al. J Lipid Res. 2011 Mar.

Abstract

Obesity is accompanied by adipocyte death and accumulation of macrophages and mast cells in expanding adipose tissues. Considering the differences in biological behavior of fat found in different anatomical locations, we explored the distribution of mast cells, solitary macrophages, and crown-like structures (CLS), the surrogates for dead adipocytes, in subcutaneous and abdominal visceral fat of lean and diet-induced obese C57BL/6 mice. In fat depots of lean mice, mast cells were far less prevalent than solitary macrophages. Subcutaneous fat contained more mast cells, but fewer solitary macrophages and CLS, than visceral fat. Whereas no significant change in mast cell density of subcutaneous fat was observed, obesity was accompanied by a substantial increase in mast cells in visceral fat. CLS became prevalent in visceral fat of obese mice, and the distribution paralleled mast cells. Adipose tissue mast cells contained and released preformed TNF-α, the cytokine implicated in the pathogenesis of obesity-linked insulin resistance. In summary, subcutaneous fat differed from visceral fat by immune cell composition and a lower prevalence of CLS both in lean and obese mice. The increase in mast cells in visceral fat of obese mice suggests their role in the pathogenesis of obesity and insulin resistance.


Figures

Fig. 1.
Fig. 1.
Glucose homeostatic parameters and abdominal fat depots. Fasting body weight (A), blood glucose (B) and serum insulin (C) concentrations, and HOMA-IR (D) of C57BL/6 mice fed on a low-fat diet (LFD, □) or a high-fat diet (HFD, ▪) are shown (n = 10 in each group). Subcutaneous (SAT), mesenteric (MAT), perinephric (PAT), and epididymal (EAT) adipose tissues of a male mouse are demonstrated in vivo (E). epi, epididymis; kid, kidney; P, peritoneum; SB, small bowels. Data are expressed as means ± SEM. ***P < 0.001.
Fig. 2.
Fig. 2.
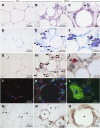
Mast cells, solitary ATM, and CLS in adipose tissues. Mast cells (arrows) are shown in the epididymal fat of lean (left column) and obese (middle and right columns) C57BL/6 mice. Tissue sections were stained with hematoxylin and eosin (A-C), toluidine blue (D-F), naphthol AS-D chloroacetate (G-I), and fluorescein-labeled avidin (J-L). The latter was counterstained with DAPI to demonstrate nuclei (blue) and was examined under a confocal microscope. As evidenced by the presence of extracellular granules (circles), a mast cell in the process of degranulation is shown (L). Immunohistochemical staining for F4/80 identified solitary ATM (arrowheads) and CLS (stars) (M-O). Solitary ATM were found scattered between adipocytes (M). CLS consist of several macrophages surrounding adipocytes. (N-O). Scale bars as indicated. ATM, adipose tissue macrophages; CLS, crown-like structures.
Fig. 3.
Fig. 3.
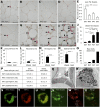
Distribution of mast cells in abdominal fat depots. The densities of mast cells were determined in subcutaneous (SAT), mesenteric (MAT), perinephric (PAT), and epididymal (EAT) adipose tissues of lean (□) and obese (▪) mice (A-P). In lean mice, subcutaneous adipose tissue contained more mast cells than visceral adipose tissues (A-E). In obese mice, however, mast cells were more prevalent in visceral adipose tissues (F-J). Whereas no significant change in mast cell density of subcutaneous adipose tissue was observed (K), obesity was accompanied by a substantial increase in mast cells in mesenteric (L), perinephric (M), and epididymal (N) adipose tissues. The largest increase in mast cell density was seen in epididymal adipose tissue in obese mice (O, P). Ultrastructural examination demonstrated mast cells packed with membrane-bound electron-dense granules (Q, R). Confocal micrographs show a fluorescein-labeled mast cell containing TNF-α in the epididymal adipose tissue of an obese mouse (S-U). TNF-α was also present in extracellular granules (circles) adjacent to a degranulating mast cell (V-X). Scale bars: 50 μm or as indicated. Data are expressed as mean ± SEM. *P < 0.05, **P < 0.01, ***P < 0.001. TNF-α, tumor necrosis factor α.
Fig. 4.
Fig. 4.
Distribution of solitary ATM in abdominal fat depots. In lean C57BL/6 mice, solitary ATM were distributed differentially in abdominal fat depots (A-E). Solitary ATM were less prevalent in subcutaneous (SAT) than perinephric (PAT) and epididymal (EAT) adipose tissues (E-F). Solitary ATM were far more abundant than mast cells in all four abdominal fat depots examined (F-H). Scale bars: 50 μm. Data are expressed as mean ± SEM. **P < 0.01, ***P < 0.001. ATM, adipose tissue macrophages.
Fig. 5.
Fig. 5.
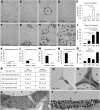
Distribution of CLS in abdominal fat depots. CLS (stars) were distributed differentially in subcutaneous (SAT), mesenteric (MAT), perinephric (PAT), and epididymal (EAT) adipose tissues of lean (□) and obese (▪) mice (A-J). In both lean and obese mice, subcutaneous adipose tissue had the lowest prevalence of CLS (A-J). Obesity was accompanied by a substantial increase in the density of CLS in subcutaneous (K), mesenteric (L), perinephric (M), and epididymal (N) fat depots. Ultrastructural examination demonstrated adipocytes with narrow cytoplasmic rims surrounding lipid cores in lean mice (Q). In obese mice, however, macrophages (arrowheads) and mast cells (arrow) enveloped adipocytes forming CLS (stars) (R). On higher magnification, many macrophages (arrowheads) and mast cells (arrow) were found abutting on lipid cores with no evidence of the cytoplasm of adipocytes (S, T). Scale bars: 50 μm or as indicated. Data are expressed as mean ± SEM. *P < 0.05, **P < 0.01, ***P < 0.001. CLS, crown-like structures.

References

    1. Mokdad A. H., Ford E. S., Bowman B. A., Dietz W. H., Vinicor F., Bales V. S., Marks J. S. 2003. Prevalence of obesity, diabetes, and obesity-related health risk factors, 2001. JAMA. 289: 76–79. - PubMed
    1. Hotamisligil G. S. 2006. Inflammation and metabolic disorders. Nature. 444: 860–867. - PubMed
    1. Hotamisligil G. S., Shargill N. S., Spiegelman B. M. 1993. Adipose expression of tumor necrosis factor-alpha: direct role in obesity-linked insulin resistance. Science. 259: 87–91. - PubMed
    1. Uysal K. T., Wiesbrock S. M., Marino M. W., Hotamisligil G. S. 1997. Protection from obesity-induced insulin resistance in mice lacking TNF-alpha function. Nature. 389: 610–614. - PubMed
    1. Xu H., Barnes G. T., Yang Q., Tan G., Yang D., Chou C. J., Sole J., Nichols A., Ross J. S., Tartaglia L. A., et al. 2003. Chronic inflammation in fat plays a crucial role in the development of obesity-related insulin resistance. J. Clin. Invest. 112: 1821–1830. - PMC - PubMed

Publication types

LinkOut - more resources