. 2011 Feb 25;286(8):6577-86.
doi: 10.1074/jbc.M110.190397. Epub 2010 Dec 9.

Bi-modal regulation of a formin by srGAP2

Affiliations

Bi-modal regulation of a formin by srGAP2

Frank M Mason et al. J Biol Chem. .

Abstract

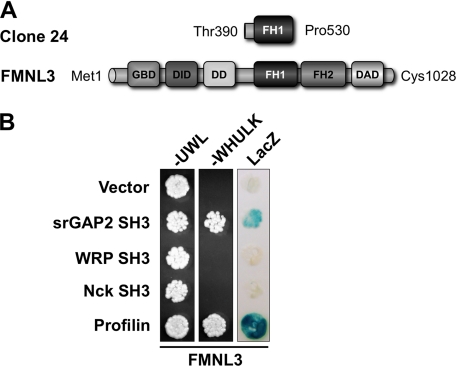
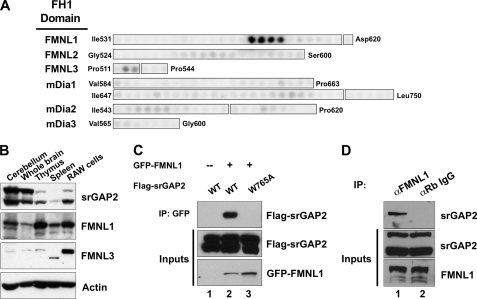
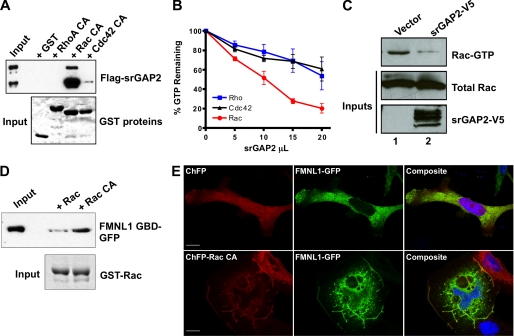
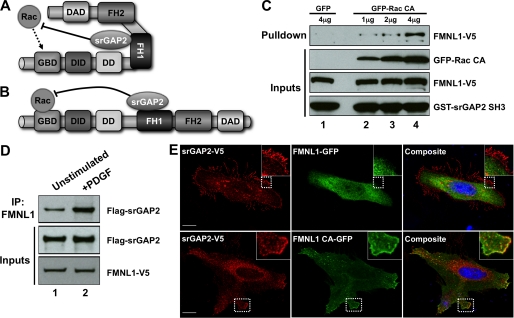
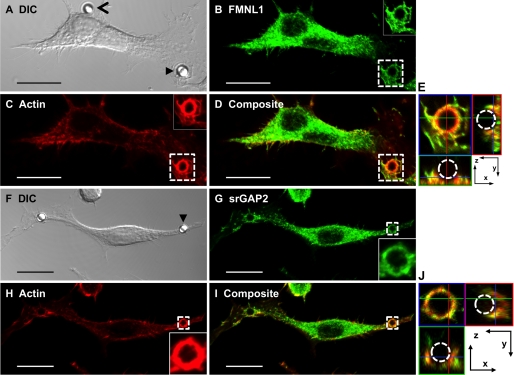
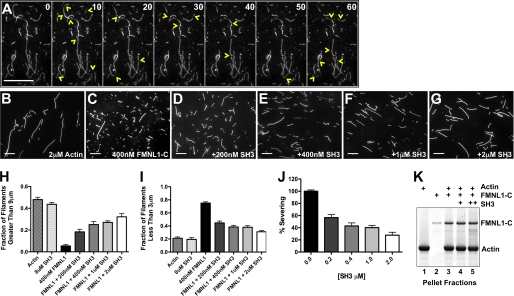
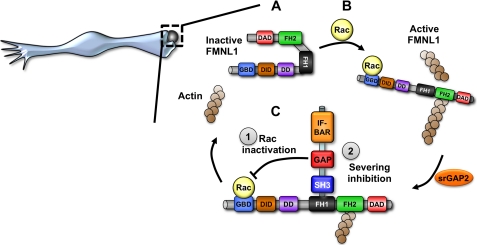
The maintenance of rapid and efficient actin dynamics in vivo requires coordination of filament assembly and disassembly. This regulation requires temporal and spatial integration of signaling pathways by protein complexes. However, it remains unclear how these complexes form and then regulate the actin cytoskeleton. Here, we identify a srGAP2 and formin-like 1 (FMNL1, also known as FRL1 or FRLα) complex whose assembly is regulated by Rac signaling. Our data suggest srGAP2 regulates FMNL1 in two ways; 1) Rac-mediated activation of FMNL1 leads to the recruitment of srGAP2, which contains a Rac-specific GAP domain; 2) the SH3 domain of srGAP2 binds the formin homology 1 domain of FMNL1 to inhibit FMNL1-mediated actin severing. Thus, srGAP2 can efficiently terminate the upstream activating Rac signal while also opposing an important functional output of FMNL1, namely actin severing. We also show that FMNL1 and srGAP2 localize to the actin-rich phagocytic cup of macrophage-derived cells, suggesting the complex may regulate this Rac- and actin-driven process in vivo. We propose that after Rac-dependent activation of FMNL1, srGAP2 mediates a potent mechanism to limit the duration of Rac action and inhibit formin activity during rapid actin dynamics.


Figures

FIGURE 1.
FIGURE 1.
Two-hybrid analysis of srGAP2 SH3 domain interactions. A, a schematic shows the fragment of FMNL3 identified in the library screen using the srGAP2 SH3 domain bait. Amino acid positions are indicated for each. B, specificity of the srGAP2 and FMNL3 interaction was verified in the two-hybrid assay. Yeast containing clone 24 and either empty vector (negative control), srGAP2 SH3, WRP SH3, Nck SH3, or profilin (positive control) were plated onto plates lacking uracil, tryptophan, and leucine (−UWL) or also histidine and lysine (−WHULK). Although all yeast could grow on the −UWL plate, indicating the yeast contain both bait and prey vectors, only the srGAP2 and profilin containing yeast grew on the −WHULK plates, confirming an interaction. Yeast were also assayed for β-galactosidase activity (LacZ), which further confirmed srGAP2 SH3 is specific for FMNL3. DD stands for dimerization domain.
FIGURE 2.
FIGURE 2.
srGAP2 forms a complex with FMNL1. A, shown is a peptide array analysis of the binding specificity of the srGAP2 SH3 domain for the FH1 domains of several formins. The beginning and ending amino acid positions indicate regions synthesized as 20-mer peptides offset every 3 amino acids. Binding was detected by overlay of γ-32P-radiolabeled GST-srGAP2 SH3. Results suggested the srGAP2 SH3 domain prefers peptides within the FMNL1 FH1 domain. B, expression distribution of srGAP2, FMNL1, and FMNL3 were determined by Western blot analysis using specific antibodies. Actin was used as a control for loading. Each panel is labeled to the right, and each tissue or cell line is labeled above each panel. RAW cells are a macrophage-derived cell line. C, full-lengths rGAP2 and FMNL1 interact by co-immunoprecipitation (IP). Cells were transfected with GFP-FMNL1 alone (lane 1) or with FLAG-srGAP2 (lane 2) or FLAG-srGAP2 with a point mutation in the SH3 domain (tryptophan 765 to alanine; lane 3). Immunoprecipitation of FMNL1 co-precipitated wild type srGAP2 (lane 2, top panel), but GFP alone or the SH3 mutant of srGAP2 did not (lanes 1 and 2, top panel). Immunoblot analysis of extracts indicated equal levels of srGAP2 in all three lysates (middle panel) and similar levels of FMNL1 (bottom panel). D, endogenous FMNL1 and srGAP2 form a complex in cells. Immunoprecipitation of FMNL1 co-precipitates srGAP2 from HeLa cells (lane 1), whereas α-rabbit IgG (negative control) does not (lane 2).
FIGURE 3.
FIGURE 3.
Regulation of the Rac-srGAP2-FMNL1 pathway. A, shown is a GTPase specificity pulldown assay for srGAP2. Lysate from cells expressing srGAP2 (top panel, input) were incubated with GST-fused constitutively active Rho, Rac, or Cdc42 on glutathione beads (bottom panel, Coomassie stain). After centrifugation, bead fractions were assayed for bound srGAP2 by Western blot analysis (top panel). srGAP2 specifically associated with Rac but did not interact with Rho or Cdc42. B, shown is an in vitro GTPase assay for srGAP2 GAP specificity. 300 ng of purified Rho, Rac, and Cdc42 were loaded with radiolabeled GTP and incubated with increasing amounts of full-length srGAP2. srGAP2 exhibited greater GAP activity toward Rac when compared with Rho or Cdc42. C, shown is a cellular assay for srGAP2 Rac-GAP activity. Cells were transfected with empty vector or srGAP2 (bottom panel), and levels of Rac-GTP were analyzed (top panel) compared with total Rac (middle panel) by the p21-activated kinase pulldown assay. Cells expressing srGAP2 had lower levels of Rac-GTP, confirming Rac GAP activity in situ. D, shown is an activity-dependent interaction of FMNL1 with Rac. Lysates (Input) from cells expressing the FMNL1 GTPase binding domain (FMNL1 GBD; amino acids 1–450) were subjected to a pulldown assay using wild-type Rac or constitutively active Rac (RacCA) bound to beads as GST fusion (bottom panel). The FMNL1 GTPase binding domain preferentially interacted with active Rac. E, regulation of membrane targeting of FMNL1 by Rac is shown. Cells were co-transfected with either cherry fluorescent protein (ChFP) and FMNL1-GFP (top panels) or ChFP-Rac CA and FMNL1-GFP (bottom panels). Without active Rac, FMNL1 was predominately cytosolic, whereas with constitutively Rac, FMNL1 was enriched in membrane ruffles where it co-localized with Rac. The scale bar represents 15 μm.
FIGURE 4.
FIGURE 4.
Dynamic assembly of the srGAP2·FMNL1 complex. A and B, shown is a schematic of possible roles for srGAP2 in regulating GTPase signaling to FMNL1. A, in this model srGAP2 is bound to FMNL1 in the inactive state and limits the ability of Rac to activate FMNL1. This could favor the specificity of FMNL1 activation toward other GTPases such as Cdc42. B, in this model srGAP2 only binds to activated FMNL1, where it functions to turn off Rac after activation is achieved. C, GST srGAP2 SH3 (bottom panel) pulldown from cells expressing FMNL1 (second panel from bottom) and increasing amounts of constitutively active Rac (Rac CA; third panel from bottom; lanes 2–4). Whereas very little FMNL1 associated with the srGAP2 SH3 domain in the absence of active Rac (lane 1), increasing amounts of FMNL1 co-associated with the SH3 domain in the presence of increasing levels of active Rac (lanes 2–4). D, association of the srGAP2·FMNL1 complex was analyzed by co-immunoprecipitation without (IP, lane 1) or with (lane 2) PDGF stimulation from cells co-transfected with srGAP2 (middle panel) and FMNL1 (bottom panel). Increased complex association was observed following PDGF stimulation (top panel). E, srGAP2 preferentially associates with the active form of FMNL1 in cells. Cells were co-transfected with srGAP2 and either GFP- tagged wild-type FMNL1 (top panels) or GFP tagged constitutive active FMNL1 (bottom panels; FMNL1 CA). Immunostaining for srGAP2 showed cytosolic and membrane staining that co-localized with FMNL1 CA (bottom panels). The inset shows higher magnification images of the corresponding boxed regions. The scale bar represents 15 μm. DD stands for dimerization domain.
FIGURE 5.
FIGURE 5.
Localization of FMNL1 and srGAP2 to the actin-rich phagosome during phagocytosis. Co-localization of FMNL1 (A–E) or srGAP2 (F–J) with F-actin during phagocytosis is shown. A and F, differential contrast image (DIC) of a RAW cell incubated with Fc-coated beads is shown. Closed arrowheads indicate a bead undergoing phagocytosis, and an open arrowhead indicates a nearby bead that is not being phagocytosed. Maximum projection images depicting immunolocalization of endogenous FMNL1 (B), srGAP2 (G), phalloidin-stained actin (C and H), or composite images (D and I) are shown. Insets correspond to boxed regions. E and J, images depict composite boxed regions from panels D and I. The central image, surrounded by blue in E and J is a 0.25-μm section from the z-stack. The images below and to the side of this section are orthogonal projections of the phagocytosis cup. The images to the bottom (surrounded by green) represent the image projected where the green line bisects the stack. The images to the right (surrounded by red) indicate the image projected where the red line bisects the stack. The blue lines seen in the images to the bottom and right are the z-position of the central image section. The scale bar represents 15 μm.
FIGURE 6.
FIGURE 6.
Regulation of FMNL1-mediated actin filament severing by the srGAP2 SH3 domain. A, shown are time-lapse images of polymerized actin filaments every 10 s in the presence of purified active FMNL1-C (amino acids 449–1094). Numbers in the upper right corner of each frame indicate time. Extensive severing is observed during the 1-min time-lapse period. Yellow arrowheads mark the locations of new filament severing events in each frame. B–G, shown are images of actin filaments (2 μm) either alone (B), with FMNL1-C (400 nm) (C), or with FMNL1-C and increasing concentrations of the purified srGAP2 SH3 domain (D–G). Scale bar represents 15 μm. H–J, quantification of filament lengths from three independent severing assays show the fraction of filaments longer than 9 μm (H) or shorter than 3 μm for each condition (I). J, shown is percent severing as calculated from H and I for increasing concentrations of the srGAP2 SH3 domain. Scale bars represent 15 μm. Error is ±S.E. K, polymerized actin filaments (250 nm, lane 1), stabilized by phalloidin, are pelleted by ultracentrifugation in the presence of FMNL1-C (100 nm) without and with srGAP2 SH3 (200 and 400 nm, lanes 4 and 5, respectively). In the absence of actin, FMNL1-C does not co-pellet with actin filaments (lane 2). With actin filaments, FMNL1-C does co-pellet (lane 3), and the srGAP2 SH3 domain does not disrupt this interaction (lane 4 and 5).
FIGURE 7.
FIGURE 7.
Model of srGAP2 bi-modal regulation of FMNL1-actin signaling during phagocytosis. A, FMNL1 is basally inhibited and cytosolic. Upon activation by Rac (B) FMNL1 translocates to the membrane, and the active form of FMNL1 can bind and sever actin filaments. This potentially regulates Fc-γ receptor-mediated phagocytosis in macrophages. C, in this active state srGAP2 can bind FMNL1 at the membrane to inactivate the Rac signal (1) and inhibit the severing activity of FMNL1 (2). This would return FMNL1 to its quiescent, inactive state. This recycling mechanism could be responsible for rapid turnover of actin filaments and Rac signaling during phagocytosis. DD stands for dimerization domain.

References

    1. Pollard T. D., Borisy G. G. (2003) Cell 112, 453–465 - PubMed
    1. Weaver A. M., Young M. E., Lee W. L., Cooper J. A. (2003) Curr. Opin. Cell Biol. 15, 23–30 - PubMed
    1. Chesarone M. A., Goode B. L. (2009) Curr. Opin. Cell Biol. 21, 28–37 - PMC - PubMed
    1. Soderling S. H. (2009) Sci. Signal. 2, pe5 - PMC - PubMed
    1. Jaffe A. B., Hall A. (2005) Annu. Rev. Cell Dev. Biol. 21, 247–269 - PubMed

Publication types