. 2011 Feb 18;286(7):5519-28.
doi: 10.1074/jbc.M110.149823. Epub 2010 Dec 10.

Peroxisome proliferator-activated receptor gamma negatively regulates IFN-beta production in Toll-like receptor (TLR) 3- and TLR4-stimulated macrophages by preventing interferon regulatory factor 3 binding to the IFN-beta promoter

Affiliations

Peroxisome proliferator-activated receptor gamma negatively regulates IFN-beta production in Toll-like receptor (TLR) 3- and TLR4-stimulated macrophages by preventing interferon regulatory factor 3 binding to the IFN-beta promoter

Wei Zhao et al. J Biol Chem. .

Abstract

Toll-like receptors 3 and 4 utilize adaptor TRIF to activate interferon regulatory factor 3 (IRF3), resulting in IFN-β production to mediate anti-viral and bacterial infection. Peroxisome proliferator-activated receptor (PPAR)-γ is a ligand-activated transcription factor expressed in various immune cells and acts as a transcriptional repressor to inhibit the transcription of many proinflammatory cytokines. But, the function of PPAR-γ in TLR3- and -4-mediated IFN-β production is not well elucidated. Here, we have analyzed the effect of the PPAR-γ agonists on IFN-β production in peritoneal primary macrophages in response to LPS and poly(I:C). PPAR-γ agonists inhibited LPS and poly(I:C)-induced IFN-β transcription and secretion. siRNA knockdown of PPAR-γ expression and transfection of PPAR-γ expression plasmid demonstrated that PPAR-γ agonist inhibits IFN-β production in a PPAR-γ-dependent manner. The ability of the PPAR-γ agonist to inhibit IFN-β production was confirmed in vivo as mice treated with troglitazone exhibited decreased levels of IFN-β upon LPS and poly(I:C) challenge. Chromatin immunoprecipitation (CHIP) assay and electrophoretic mobility shift assay (EMSA) demonstrated that troglitazone treatment impaired IRF3 binding to the IFN-β promoter. Furthermore, troglitazone could inhibit LPS and poly(I:C)-induced STAT1 phosphorylation and subsequent ISRE activation. These results demonstrate that PPAR-γ negatively regulates IFN-β production in TLR3- and 4-stimulated macrophages by preventing IRF3 binding to the IFN-β promoter.


Figures

FIGURE 1.
FIGURE 1.
PPAR-γ agonists negatively regulate TLR3- and TLR4-induced IFN-β production in macrophages. A and B, mouse peritoneal macrophages were pretreated with DMSO, 30 μm troglitazone for 40 min and then stimulated with 100 ng/ml of LPS or 20 μg/ml of poly(I:C) for the indicated time periods. The production of IFN-β was detected by ELISA. C, mouse peritoneal macrophages were stimulated with 20 μg/ml of poly(I:C) in the presence of DMSO or troglitazone, then expression of IFN-β mRNA was examined by quantitative PCR. For quantitative PCR, the results were presented as fold-expression of IFN-β mRNA to that of β-actin. D, mouse peritoneal macrophages were pretreated with DMSO or troglitazone (1, 2, 5, 10, 30, and 50 μm) for 40 min and then stimulated with 20 μg/ml of poly(I:C) for 8 h. The production of IFN-β was detected by ELISA. E, mouse peritoneal macrophages were pretreated with DMSO, 10 μm troglitazone, 10 μm rosiglitazone, or 10 μm 15d-PGJ2 for 40 min and then stimulated with 100 ng/ml of LPS or 20 μg/ml of poly(I:C) for 8 h. The production of IFN-β was detected by ELISA. F, mouse peritoneal macrophages were stimulated with 100 ng/ml of LPS or 20 μg/ml of poly(I:C) for 8 h in the presence of DMSO or troglitazone. The production of TNF-α and IL-6 were detected by ELISA. NO was detected by the Griess reaction. Data are shown as mean ± S.D. (n = 3) of one representative experiment. **, p < 0.01, ▴, p > 0.05.
FIGURE 2.
FIGURE 2.
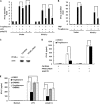
Troglitazone inhibits IFN-β production in a PPAR-γ-dependent manner. A, RAW264.7 cells in 96-well plates (2.5 × 10⁴/well) were transiently co-transfected with 100 ng of IFN-β reporter plasmid and 10 ng of pTK-Renilla plasmid, together with 100 ng of PPAR-γ or control plasmid. After 24 h, cells were pretreated with DMSO, 30 μm troglitazone for 40 min and then stimulated with 100 ng/ml of LPS or 20 μg/ml of poly(I:C) for 6 h. Luciferase activity was measured and normalized by Renilla luciferase activity. Data are shown as mean ± S.D. (n = 6) of one representative experiment. B, HEK293 cells were transfected with 100 ng of IFN-β luciferase reporter plasmid, 10 ng of pTK-Renilla plasmid, 100 ng of TRIF expressing plasmid, together with 100 ng of PPAR-γ or control plasmid. After 8 h of culture, cells were treated and luciferase activity was measured as above. C, mouse peritoneal macrophages were transfected with control small RNA (Ctrl RNAi) or PPAR-γ siRNA (PPAR-γ RNAi). After 36 h, PPAR-γ expression in the cells was detected by immunoblot. Similar results were obtained in three independent experiments. D, 1.5 × 10⁵ mouse peritoneal macrophages were transfected with control small RNA or PPAR-γ siRNA. After 36 h, cells were stimulated with 20 μg/ml of poly(I:C) for 4 h in the presence of DMSO or troglitazone, then IFN-β in the supernatants was measured by ELISA. E, mouse peritoneal macrophages were pretreated with DMSO, 30 μm troglitazone, 1 μm GW9662, or 30 μm troglitazone with 1 μm GW9662 for 40 min and then stimulated with 100 ng/ml of LPS or 20 μg/ml of poly(I:C) for 8 h. The production of IFN-β was detected by ELISA. Data are shown as mean ± S.D. (n = 3) of one representative experiment. **, p < 0.01, ▴, p > 0.05.
FIGURE 3.
FIGURE 3.
PPAR-γ inhibits IRF3 transcriptional activation. A, RAW264.7 cells in 96-well plates (2.5 × 10⁴/well) were transiently co-transfected with 100 ng of IRF3 reporter plasmid, 10 ng of pTK-Renilla plasmid, and 100 ng of PPAR-γ expression plasmid or control plasmid. After 24 h, cells were treated and luciferase activity was measured. B, HEK293 cells were transfected with 100 ng of IRF3 luciferase reporter plasmid, 10 ng of pTK-Renilla plasmid, 100 ng of TRIF expressing plasmid, together with 100 ng of PPAR-γ or control plasmid. After 8 h of culture, cells were treated and luciferase activity was measured. C, mouse peritoneal macrophages were pretreated with DMSO, 30 μm troglitazone for 40 min and then stimulated with 100 ng/ml of LPS or 20 μg/ml of poly(I:C) for the indicated time periods. The production of RANTES was detected by ELISA. Data are shown as mean ± S.D. (n = 3) of one representative experiment. **, p < 0.01. Filled triangle, p > 0.05.
FIGURE 4.
FIGURE 4.
PPAR-γ prevents IRF3 binding to IFN-β promoter. A, mouse peritoneal macrophages were stimulated with 20 μg/ml of poly(I:C) for the indicated time periods in the presence of DMSO or troglitazone. Phosphorylated IRF3 (Ser-396) and total IRF3 in lysates were detected by immunoblot. Similar results were obtained in three independent experiments. B, mouse peritoneal macrophages were stimulated as above, then nuclear fractions were extracted and IRF3 were detected by immunoblot. The purity of the obtained nuclear fractions was confirmed with anti-Hsp90 (marker for the cytoplasmic fraction) and anti-Sp1 (marker for the nuclear fraction) antibodies. Similar results were obtained in three independent experiments. C and D, mouse peritoneal macrophages were stimulated and nuclear extracts were prepared as above. EMSA was performed with the biotin-labeled IRF3 oligonucleotides to determine IRF3 binding to the IFN-β promoter. In competitive binding assays, noncompetitive binding assays and supershift assays, unlabeled IRF3 oligonucleotides, unlabeled EBNA oligonucleotides, and IRF3 antibody were incubated with nuclear extracts from poly(I:C)-stimulated cells for 60 min in the absence of troglitazone, respectively. Similar results were obtained in three independent experiments. E and F, mouse peritoneal macrophages were treated as above, ChIP assays were performed to assess the binding of IRF3 and PPAR-γ to the IRF3 binding sites within the −200 to −41 region of the murine IFN-β promoter. Total extract was used as a loading control, and immunoprecipitation with irrelevant antibody (anti-actin) was used as a negative control. PCR products of an IRF3 site-free region within −391 to −261 of the murine IFN-β promoter were used as specificity controls. Similar results were obtained in three independent experiments.
FIGURE 5.
FIGURE 5.
PPAR-γ negatively regulates TLR3- and TLR4-induced IFN-β production in vivo. Female C57BL/6J mice (5–6 weeks old) were intraperitoneally injected with thioglycolate to elicit peritoneal macrophages. After 3 days, the mice were treated with DMSO or 5 mg/kg of troglitazone intraperitoneal administration for 40 min, and then treated with PBS, 1.8 mg/kg of LPS or 1 mg/kg of poly(I:C) intraperitoneal administration for 4 h. IFN-β in the lavage (A) and serum (B) were detected by ELISA. RANTES production in the lavage (C) and serum (D) were also detected by ELISA. Data are shown as mean ± S.D. (n = 3) of one representative experiment (*, p < 0.05, **, p < 0.01).
FIGURE 6.
FIGURE 6.
PPAR-γ inhibits TLR3- and TLR4-induced activation of STAT1. A and B, mouse peritoneal macrophages were stimulated with 20 μg/ml of poly(I:C) or 100 ng/ml of LPS in the presence of DMSO or troglitazone. Phosphorylated STAT1 (Tyr-701) and total STAT1 in lysates were detected by immunoblot. Similar results were obtained in three independent experiments. C, mouse peritoneal macrophages were transfected with control small RNA (Ctrl RNAi) or PPAR-γ siRNA (PPARRNAi). After 36 h, cells were treated as above, and phosphorylated STAT1 (Tyr-701) and total STAT1 in lysates were detected by immunoblot. Similar results were obtained in three independent experiments. D, RAW264.7 cells in 96-well plates (2.5 × 10⁴/well) were transiently co-transfected with 100 ng of ISRE reporter plasmid, 10 ng of pTK-Renilla plasmid, and 100 ng of PPAR-γ expression plasmid or control plasmid. After 24 h, cells were stimulated with 100 ng/ml of LPS or 20 μg/ml of poly(I:C) for 6 h in the DMSO or troglitazone. Luciferase activity was measured and normalized by Renilla luciferase activity. Data are shown as mean ± S.D. (n = 6) of one representative experiment (**, p < 0.01, ▴, p > 0.05).

Similar articles

Cited by

References

    1. Kawai T., Akira S. (2006) Nat. Immunol. 7, 131–137 - PubMed
    1. Hertzog P. J., O'Neill L. A., Hamilton J. A. (2003) Trends Immunol. 24, 534–539 - PubMed
    1. Kenny E. F., O'Neill L. A. (2008) Cytokine 43, 342–349 - PubMed
    1. Banchereau J., Pascual V. (2006) Immunity 25, 383–392 - PubMed
    1. Mangini A. J., Lafyatis R., Van Seventer J. M. (2007) Ann. N.Y. Acad. Sci. 1108, 11–23 - PubMed

Publication types

MeSH terms