. 2011 Feb 25;286(8):6367-74.
doi: 10.1074/jbc.M110.206227. Epub 2010 Dec 10.

Mechanism of melibiose/cation symport of the melibiose permease of Salmonella typhimurium

Affiliations

Mechanism of melibiose/cation symport of the melibiose permease of Salmonella typhimurium

Lan Guan et al. J Biol Chem. .

Abstract

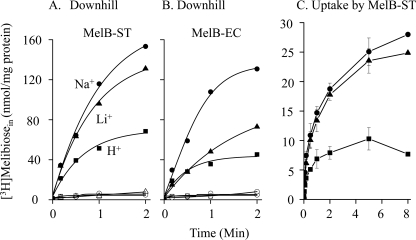
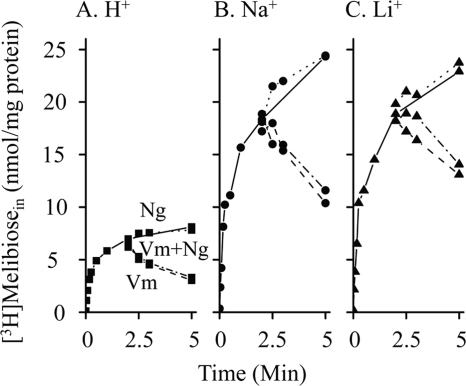
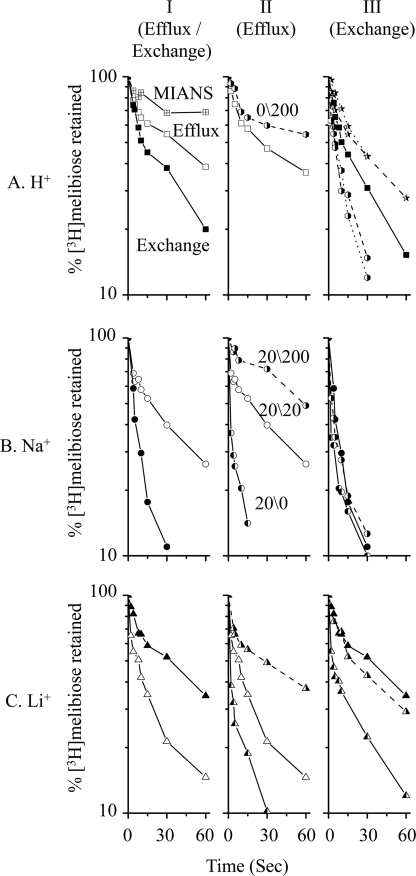
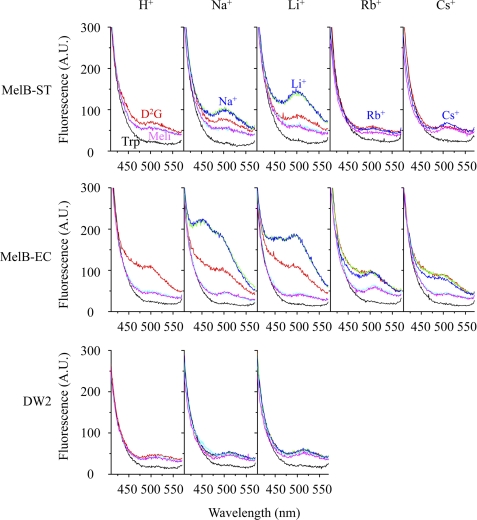
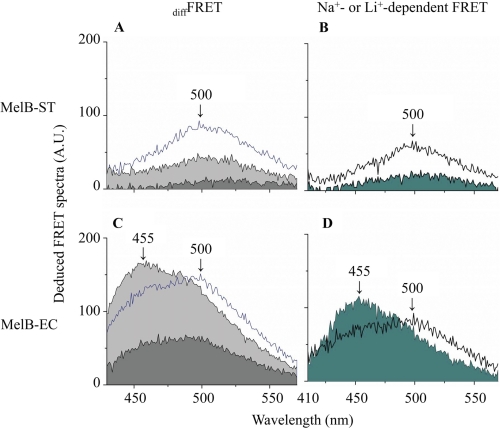
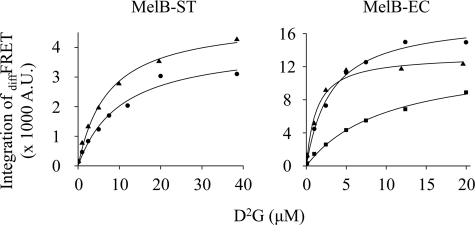
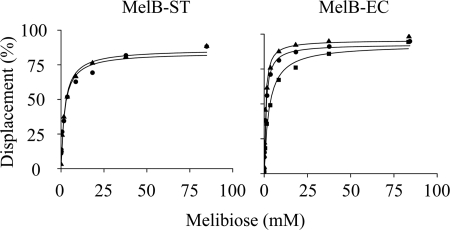
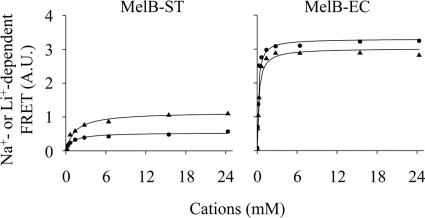
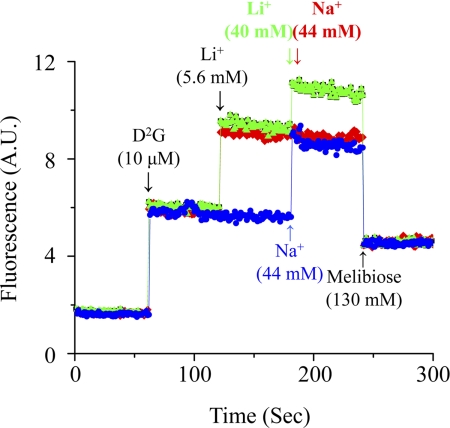
The MelB permease of Salmonella typhimurium (MelB-ST) catalyzes the coupled symport of melibiose and Na(+), Li(+), or H(+). In right-side-out membrane vesicles, melibiose efflux is inhibited by an inwardly directed gradient of Na(+) or Li(+) and stimulated by equimolar concentrations of internal and external Na(+) or Li(+). Melibiose exchange is faster than efflux in the presence of H(+) or Na(+) and stimulated by an inwardly directed Na(+) gradient. Thus, sugar is released from MelB-ST externally prior to the release of cation in agreement with current models proposed for MelB of Escherichia coli (MelB-EC) and LacY. Although Li(+) stimulates efflux, and an outwardly directed Li(+) gradient increases exchange, it is striking that internal and external Li(+) with no gradient inhibits exchange. Furthermore, Trp → dansyl FRET measurements with a fluorescent sugar (2'-(N-dansyl)aminoalkyl-1-thio-β-D-galactopyranoside) demonstrate that MelB-ST, in the presence of Na(+) or Li(+), exhibits (app)K(d) values of ∼1 mM for melibiose. Na(+) and Li(+) compete for a common binding pocket with activation constants for FRET of ∼1 mM, whereas Rb(+) or Cs(+) exhibits little or no effect. Taken together, the findings indicate that MelB-ST utilizes H(+) in addition to Na(+) and Li(+). FRET studies also show symmetrical emission maximum at ∼500 nm with MelB-ST in the presence of 2'-(N-dansyl)aminoalkyl-1-thio-β-D-galactopyranoside and Na(+), Li(+), or H(+), which implies a relatively homogeneous distribution of conformers of MelB-ST ternary complexes in the membrane.


Figures

FIGURE 1.
FIGURE 1.
[3H]Melibiose transport. A and B, downhill transport in DW2 intact cells with overexpressed MelB-ST (A) or MelB-EC (B). Calculated intracellular [3H]melibiose concentrations were plotted as a function of time. C, uptake with RSO vesicles containing MelB-ST. Square, circle, and triangle represent data that were obtained in the presence of H+, Na+, and Li+, respectively. Na+ or Li+ (20 mm) was added by premixing with [3H]melibiose. Error bars indicate S.E.
FIGURE 2.
FIGURE 2.
Effect of ΔΨ on [3H]melibiose uptake. Active transport with RSO vesicles (pH 7.5) containing MelB-ST was carried out in the absence and presence of 20 mm Na+ (circle) or Li+ (triangle). At the 2-min time point of transport time course, 50 μm valinomycin (Vm, dashed lines), 1 μm nigericin (Ng, dotted lines), or both (dashed and dotted lines) were added into RSO vesicles.
FIGURE 3.
FIGURE 3.
[3H]Melibiose efflux and exchange. Intracellular [3H]melibiose was expressed as a percentage of the zero time point in the presence of external 200 mm Na+ or Li+. Open (Efflux) and filled (exchange) symbols represent equimolar cation concentrations across the membrane. The dashed line represents external 200 mm Na+ or Li+. A, de-energized RSO vesicles were pre-equilibrated with 20 mm [3H]melibiose without Na+ and Li+. Right-filled hexagons and stars represent the presence of external Na+ and Li+, respectively. The dotted line represents the presence of 20 mm external cations. RSO vesicles were also treated with 3.6 mm MIANS for 5 h at 23 °C and diluted into 100 mm potassium Pi, pH 7.5, in the absence of melibiose (crossed square). B and C, de-energized RSO vesicles were pre-equilibrated with 20 mm [3H]melibiose and 20 mm Na+ (B) or Li+ (C). The left-filled symbol represents the dilution buffer without Na+ or Li+ (20/0 mm). The right-filled symbol represents the dilution buffer containing 200 mm Na+ or Li+ (20/200 mm).
FIGURE 4.
FIGURE 4.
FRET. RSO vesicles prepared from DW2 cells without or with MelB at a protein concentration of 0.5 mg/ml were excited at 290 nm. Emissions were plotted between 410 and 570 nm. Sugar and cation were added into RSO vesicles sequentially according to the following order: black lines, Trp emission; red lines, D2G emission (10 μm); green lines, Na+, Li+, Rb+, or Cs+ (20 mm); blue lines, Na+ or Li+ (20 mm), Rb+ or Cs+ (100 mm); cyan and magenta lines, melibiose (130 mm). In MelB-ST with Rb+, green and cyan curves were removed for clarity. Data were measured with Hitachi F-7000 fluorescence spectrophotometer. A.U., absorbance units.
FIGURE 5.
FIGURE 5.
Deduced FRET spectra. A and C, diffFRET emission before and after the addition of excess melibiose was calculated from Fig. 4. Curves filled with light or dark gray represent the deduced diffFRET spectra in the presence of Na+ or H+, and the open blue curves represent diffFRET spectrum in the presence of Li+. B and D, Na+- and Li+-dependent FRET were calculated by subtracting the H+-coupled diffFRET and plotting in filled and open curves, respectively. A.U., absorbance units.
FIGURE 6.
FIGURE 6.
appKd for D2G. Titration of D2G was measured by FRET in the presence of H+ (square), Na+ (circle), or Li+ (triangle) with Hitachi F-7000 fluorescence spectrophotometer. diffFRET representing the bound D2G was integrated between 460 and 540 nm for MelB-ST and 440 and 530 nm for MelB-EC, and the hyperbolic function was applied to fit data (Table 1). Poor D2G FRET signal in the absence of Na+ and Li+ precluded accurate measurements in MelB-ST. A.U., absorbance units.
FIGURE 7.
FIGURE 7.
EC50 for melibiose displacement of D2G binding. With SLM-8100/DMX fluorescence spectrophotometer, displacements of D2G by melibiose at increasing concentrations were measured on a time trace with λEx 290 nm and λEm 500 nm and expressed as percentages of a total bound D2G. EC50 in the absence (square) or presence of Na+ (circle) or Li+ (triangle) was determined by hyperbolic fitting, and appKd for melibiose was calculated by the equation: appKd = EC50/{1 + [D2G]/Kd for D2G} (Table 1).
FIGURE 8.
FIGURE 8.
Cation activation constants for D2G FRET. On a time trace with λEx 290 nm and λEm 500 nm, Na+ (circle) or Li+ (triangle) at increasing concentrations was added after 10 μm D2G was added. The stimulation in FRET signal was plotted as the concentration of Na+ or Li+ presented in solution, and K0.5Na and K0.5Li were determined by hyperbolic fitting (Table 1). A.U., absorbance units.
FIGURE 9.
FIGURE 9.
Cation competition. On a time trace at λEx 290 nm and λEm 500 nm with SLM-8100/DMX fluorescence spectrophotometer, RSO containing MelB-ST was incubated with 5.6 mm Li+ (5-fold K0.5) after the addition of 10 μm D2G and followed by a saturated concentration of either Li+ (40 mm, green curve) or Na+ (44 mm, red curve) as the arrows indicate. As a control, Na+ (44 mm) was directly added without Li+ (blue curve). The FRET signals are displaced with 130 mm melibiose. A.U., absorbance units.

References

    1. Smith K. M., Slugoski M. D., Loewen S. K., Ng A. M., Yao S. Y., Chen X. Z., Karpinski E., Cass C. E., Baldwin S. A., Young J. D. (2005) J. Biol. Chem. 280, 25436–25449 - PubMed
    1. Hirayama B. A., Loo D. D., Wright E. M. (1997) J. Biol. Chem. 272, 2110–2115 - PubMed
    1. Wilson D. M., Wilson T. H. (1987) Biochim. Biophys. Acta 904, 191–200 - PubMed
    1. Saier M. H., Jr. (2000) Mol. Microbiol. 35, 699–710 - PubMed
    1. Kaback H. R., Sahin-Tóth M., Weinglass A. B. (2001) Nat. Rev. Mol. Cell Biol. 2, 610–620 - PubMed

Publication types

LinkOut - more resources