. 2011 Apr;39(7):e41.
doi: 10.1093/nar/gkq1275. Epub 2010 Dec 10.

COMODO: an adaptive coclustering strategy to identify conserved coexpression modules between organisms

Affiliations

COMODO: an adaptive coclustering strategy to identify conserved coexpression modules between organisms

Peyman Zarrineh et al. Nucleic Acids Res. 2011 Apr.

Abstract

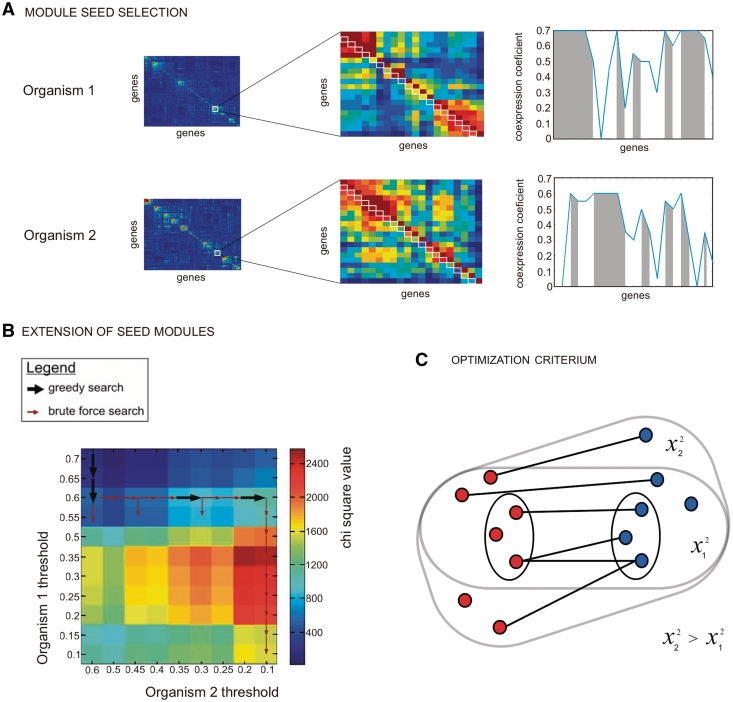
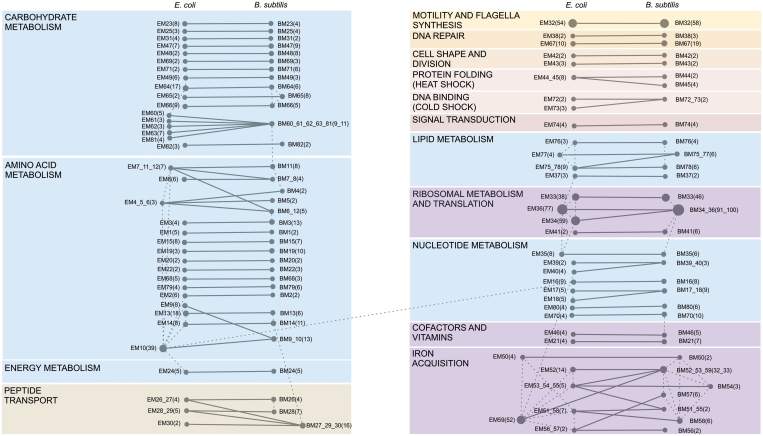
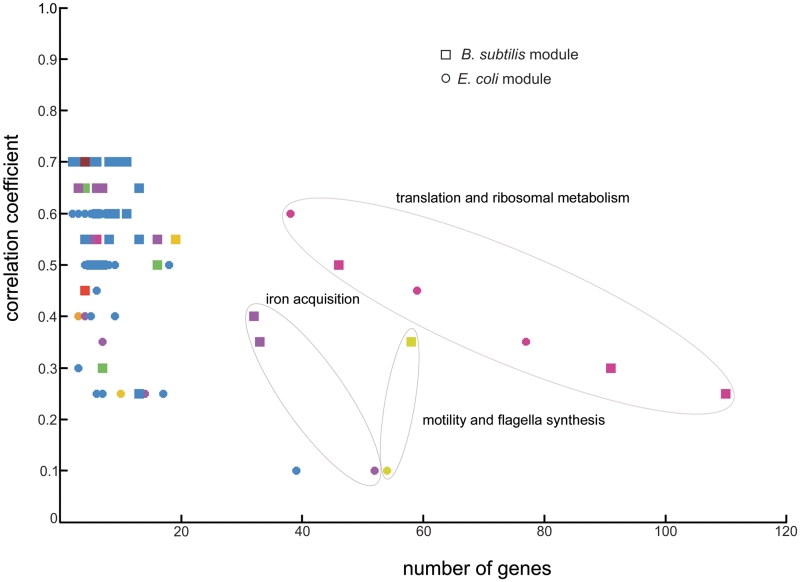
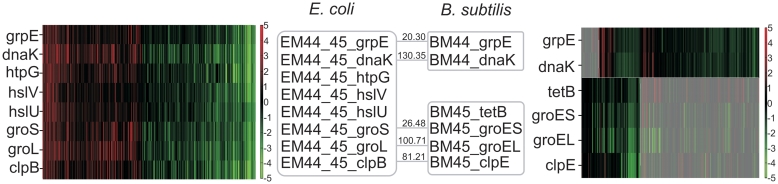
Increasingly large-scale expression compendia for different species are becoming available. By exploiting the modularity of the coexpression network, these compendia can be used to identify biological processes for which the expression behavior is conserved over different species. However, comparing module networks across species is not trivial. The definition of a biologically meaningful module is not a fixed one and changing the distance threshold that defines the degree of coexpression gives rise to different modules. As a result when comparing modules across species, many different partially overlapping conserved module pairs across species exist and deciding which pair is most relevant is hard. Therefore, we developed a method referred to as conserved modules across organisms (COMODO) that uses an objective selection criterium to identify conserved expression modules between two species. The method uses as input microarray data and a gene homology map and provides as output pairs of conserved modules and searches for the pair of modules for which the number of sharing homologs is statistically most significant relative to the size of the linked modules. To demonstrate its principle, we applied COMODO to study coexpression conservation between the two well-studied bacteria Escherichia coli and Bacillus subtilis. COMODO is available at: http://homes.esat.kuleuven.be/∼kmarchal/Supplementary_Information_Zarrineh_2010/comodo/index.html.


Figures

Figure 1.
Figure 1.
Detection of evolutionary conserved expression modules. (A) Input data constitute of expression compendia of two distinct organisms (here E. coli and B. subtilis) (left panel) as well as a homology map between genes of the respective species (here derived from COG) (right panel). In the right panel, nodes correspond to genes and edges indicate the homology relations. (B) The left panel schematically illustrates the concept of module trees. Conceptually all potential modules (indicated by rectangles) in each of the species can be represented as nested chains of partially overlapping modules that can theoretically be obtained by gradually decreasing the threshold that determines the degree of coexpression within a module. Consecutive branches of the module trees give a view of all possible module sizes that originate from seed modules (modules indicated by a star correspond to modules obtained with the most stringent threshold). The chains of nested modules are captured by the symmetric gene–gene threshold matrices in each of the species (right panel). Our cross-species coclustering procedure starts from tightly coexpressed seed modules (indicated by stars) and uses a bottom up approach to traverse these chains of nested modules in both species simultaneously to identify from all possible matching pairs the best matching one (here indicated by the modules connected by a gray line, best is defined based on the Chi-square test statistic). (C) Resulting matching module pairs are referred to as evolutionary conserved module pairs and consist of a core and a variable part.
Figure 2.
Figure 2.
Cross-species coclustering procedure. Displays the overall strategy of the coclustering approach: first ‘module seeds’ are selected from the gene–gene threshold matrices in the respective organisms. Module seeds linked by a sufficient number of homologous gene pairs are then gradually extended by traversing the space of possible cluster threshold combinations represented on the gene–gene threshold matrices of the respective species until optimality is reached. (A) Module seed selection step: the left panel represents a zoom in on the gene–gene threshold matrices of, respectively, the first and second organisms. Values on the first subdiagonal of the gene-gene threshold matrix (indicated with white rectangles) are used to select the seed modules. The right panel displays the coexpression values corresponding to this first subdiagonal of the gene–gene threshold submatrices of, respectively, organisms 1 and 2. Groups of genes that are mutually more coexpressed than with any other genes on the first subdiagonal are selected as seeds (gray areas in the plot). To prevent that we would obtain many very small seed modules we set in the gene–gene threshold matrix all values larger than a prespecified maximal coexpression stringency value equal to this value. (B) Extension of seed modules step: module seeds linked by a sufficient number of homologous gene pairs are gradually extended by traversing the space of possible cluster threshold combinations represented on the gene–gene threshold matrices in the respective organisms until optimality is reached. As it is computationally heavy to compare all possible threshold pairs, a combination of a greedy and brute force search was used to find the optimal module pair. This combination of a greedy and brute force search is represented as a dimensional grid of different threshold pairs, each with their corresponding chi-square values. The arrows indicate how the search space was traversed to find an optimal threshold pair. The search starts from the most stringent threshold pair [seed modules (top left)]. Greedy (larger black arrows) and brute force (smaller red arrows) searches are called consecutively to evaluate different thresholds pairs in an efficient way. Plot of consecutive Chi-square values obtained along the search (i.e. for the different evaluated threshold pairs). (C) Optimization criterium: a Pearson’s chi-square test was used to assess the statistical significance of a module pairs i.e. to assess to what extent the number of linking and non-linking gene pairs between two modules differ from what is expected by chance.
Figure 3.
Figure 3.
Overview of evolutionary conserved modules between E. coli and B. subtilis. A total of 82 evolutionary conserved module pairs of which the matching modules (connected by solid lines) were linked through a statistically significant set of homologs between E. coli and B. subtilis are shown. Node sizes are proportional to the number of coexpressed genes in the modules (indicated in parenthesis) and module ids correspond to those used in Supplementary Table S1. Modules showing an overlap of 30–75% of their genes within each species were connected by dashed lines. Modules that show an overlap of at least 75% in their gene content were merged. Modules to which a similar functional category was assigned were grouped (as indicated by the different panels. Panels with the same color are involved in a similar general process e.g. metabolism).
Figure 4.
Figure 4.
Degree of correlation within a coexpression module versus the number of genes it contains. Number of genes: refers to the total number of genes in the module (adding up genes in core and variable parts). A total of 82 evolutionary conserved modules between E. coli (circles) and B. subtilis (squares) are plotted. In each case the color used to represent a module corresponds to the color scheme in Figure 3 to denote the functional class (or group of related functional classes) a module was assigned to.
Figure 5.
Figure 5.
Differentiation in expression. The E. coli module EM44_45 (left panel) is covered by two different modules BM44 and BM45 in B. subtilis (right panel). Genes that belong to the same module are displayed in a gray box and homology relations are denoted by gray edges; numbers on the edges indicate Smith–Waterman alignment scores (z-values). Shaded areas in the right heatmap correspond to conditions where both B. subtilis modules do not overlap.
Figure 6.
Figure 6.
Expression divergence of duplicated genes in E. coli. Expression behavior of genes in modules EM39 (above the line in the heatmap) and EM40 (below the line in the heatmap) in E. coli (left panel). Shaded areas correspond to conditions not shared between modules. Homologous genes to the B. subtilis nrdEF operon (module BM39_40) were found in two different coexpression modules in E. coli (modules EM39 and EM40). Each module is surrounded by a gray box and homology relations are denoted by gray lines (right panel). Numbers over the lines represent Smith–Waterman alignment scores (z-values).

References

    1. Fierro AC, Vandenbussche F, Engelen K, Van de Peer Y, Marchal K. Meta analysis of gene expression data within and across species. Curr. Genom. 2008;9:525–534. - PMC - PubMed
    1. Tirosh I, Bilu Y, Barkai N. Comparative biology: beyond sequence analysis. Curr. Opin. Biotechnol. 2007;18:371–377. - PubMed
    1. Lu Y, Huggins P, Bar-Joseph Z. Cross species analysis of microarray expression data. Bioinformatics. 2009;25:1476–1483. - PMC - PubMed
    1. Lelandais G, Tanty V, Geneix C, Etchebest C, Jacq C, Devaux F. Genome adaptation to chemical stress: clues from comparative transcriptomics in Saccharomyces cerevisiae and Candida glabrata. Genome Biol. 2008;9:R164. - PMC - PubMed
    1. Stuart JM, Segal E, Koller D, Kim SK. A gene-coexpression network for global discovery of conserved genetic modules. Science. 2003;302:249–255. - PubMed

Publication types