

Thermoluminescence solid-state nanodosimetry--the peak 5A/5 dosemeter
- PMID: 21149323
- PMCID: PMC3108276
- DOI: 10.1093/rpd/ncq479
Thermoluminescence solid-state nanodosimetry--the peak 5A/5 dosemeter
Abstract
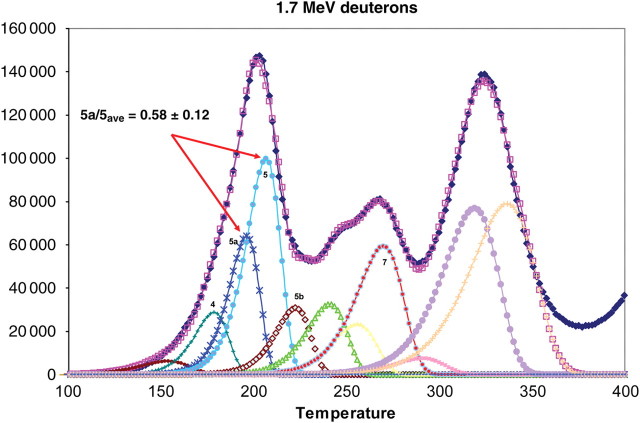
The shape of composite peak 5 in the glow curve of LiF:Mg,Ti (TLD-100) following (90)Sr/(90)Y beta irradiation, previously demonstrated to be dependent on the cooling rate used in the 400°C pre-irradiation anneal, is shown to be dependent on ionisation density in both naturally cooled and slow-cooled samples. Following heavy-charged particle high-ionisation density (HID) irradiation, the temperature of composite peak 5 decreases by ∼5°C and the peak becomes broader. This behaviour is attributed to an increase in the relative intensity of peak 5a (a low-temperature satellite of peak 5). The relative intensity of peak 5a is estimated using a computerised glow curve deconvolution code based on first-order kinetics. The analysis uses kinetic parameters for peaks 4 and 5 determined from ancillary measurements resulting in nearly 'single-glow peak' curves for both the peaks. In the slow-cooled samples, owing to the increased relative intensity of peak 5a compared with the naturally cooled samples, the precision of the measurement of the 5a/5 intensity ratio is found to be ∼15% (1 SD) compared with ∼25% for the naturally cooled samples. The ratio of peak 5a/5 in the slow-cooled samples is found to increase systematically and gradually through a variety of radiation fields from a minimum value of 0.13±0.02 for (90)Sr/(90)Y low-ionisation density irradiations to a maximum value of ∼0.8 for 20 MeV Cu and I ion HID irradiations. Irradiation by low-energy electrons of energy 0.1-1.5 keV results in values between 1.27 and 0.95, respectively. The increasing values of the ratio of peak 5a/5 with increasing ionisation density demonstrate the viability of the concept of the peak 5a/5 nanodosemeter and its potential in the measurement of average ionisation density in a 'nanoscopic' mass containing the trapping centre/luminescent centre spatially correlated molecule giving rise to composite peak 5.
Figures


References
-
- Horowitz Y., Olko P. The effects of ionization density on the thermoluminescence response (efficiency) of LiF:Mg.Ti and LiF:Mg,Cu,P. Radiat. Prot. Dosim. 2004;109:331–348. doi:10.1093/rpd/nch310. - DOI - PubMed
-
- Horowitz Y., Fuks E., Datz H., Oster L., Livingstone J., Rosenfeld A. Mysteries of LiF TLD response following high ionisation density irradiation:nanodosimetry and track structure theory, dose response and glow curve shapes. Radiat. Prot. Dosim. 2011 doi:10.1093/rpd/ncq381. - DOI - PMC - PubMed
-
- Weiss D., Horowitz Y. S., Oster L. Ionization density effects following F-centre optical excitation in LiF:Mg,Ti: analysis via track structure theory. J. Phys. D. Appl. Phys. 2009;42:085113. doi:10.1088/0022-3727/42/8/085113. - DOI
-
- Lakshmanan A. R. Thermoluminescence glow curve shape of CaF2:Tm and 7LiF produced by alpha and beta radiations. Radiat. Prot. Dosim. 1983;5:121–124.
-
- Hoffman W., Lakshmanan A. R., Spallek R. Phototransferred thermoluminescence in LiF for high LET radiation dosimetry. Radiat. Prot. Dosim. 1984;8:225–230.
Publication types
MeSH terms
Grants and funding
LinkOut - more resources
Full Text Sources
Research Materials
