

Cytoscape 2.8: new features for data integration and network visualization
- PMID: 21149340
- PMCID: PMC3031041
- DOI: 10.1093/bioinformatics/btq675
Cytoscape 2.8: new features for data integration and network visualization
Abstract
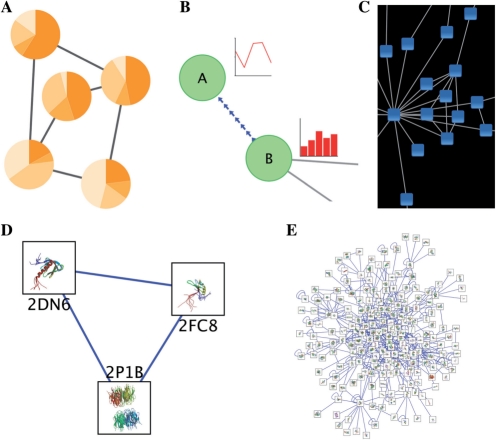
Cytoscape is a popular bioinformatics package for biological network visualization and data integration. Version 2.8 introduces two powerful new features--Custom Node Graphics and Attribute Equations--which can be used jointly to greatly enhance Cytoscape's data integration and visualization capabilities. Custom Node Graphics allow an image to be projected onto a node, including images generated dynamically or at remote locations. Attribute Equations provide Cytoscape with spreadsheet-like functionality in which the value of an attribute is computed dynamically as a function of other attributes and network properties.
Availability and implementation: Cytoscape is a desktop Java application released under the Library Gnu Public License (LGPL). Binary install bundles and source code for Cytoscape 2.8 are available for download from http://cytoscape.org.
Figures
References
Publication types
MeSH terms
Grants and funding
LinkOut - more resources
Full Text Sources
Other Literature Sources
Medical
