. 2011 Jan;21(1):83-94.
doi: 10.1101/gr.108498.110. Epub 2010 Dec 13.

LSH and G9a/GLP complex are required for developmentally programmed DNA methylation

Affiliations

LSH and G9a/GLP complex are required for developmentally programmed DNA methylation

Kevin Myant et al. Genome Res. 2011 Jan.

Abstract

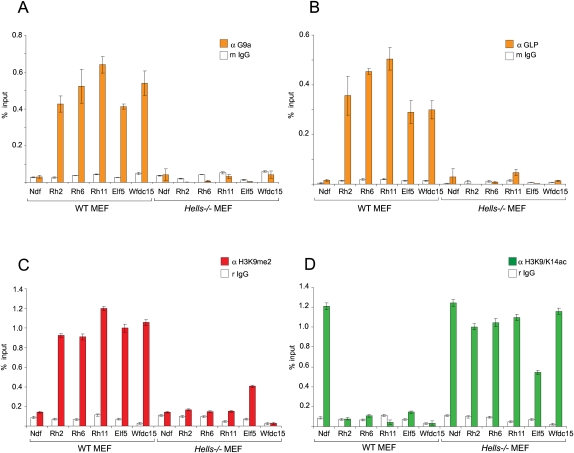
LSH, a member of the SNF2 family of chromatin remodeling ATPases encoded by the Hells gene, is essential for normal levels of DNA methylation in the mammalian genome. While the role of LSH in the methylation of repetitive DNA sequences is well characterized, its contribution to the regulation of DNA methylation and the expression of protein-coding genes has not been studied in detail. In this report we investigate genome-wide patterns of DNA methylation at gene promoters in Hells(-/-) mouse embryonic fibroblasts (MEFs). We find that in the absence of LSH, DNA methylation is lost or significantly reduced at ∼20% of all normally methylated promoter sequences. As a consequence, a large number of genes are misexpressed in Hells(-/-) MEFs. Comparison of Hells(-/-) MEFs with wild-type MEFs and embryonic stem (ES) cells suggests that LSH is important for de novo DNA methylation events that accompany the establishment and differentiation of embryonic lineage cells. We further show that the generation of normal DNA methylation patterns and stable gene silencing at specific promoters require cooperation between LSH and the G9a/GLP complex of histone methylases. At such loci, G9a recruitment is compromised when LSH is absent or greatly reduced. Taken together, our data suggest a mechanism whereby LSH promotes binding of DNA methyltransferases and the G9a/GLP complex to specific loci and facilitates developmentally programmed DNA methylation and stable gene silencing during lineage commitment and differentiation.


Figures

Figure 1.
Figure 1.
DNA methylation profiling of wild-type and Hells−/− MEFs. (A) Western blot on nuclear extracts from wild-type and Hells−/− (LSH-null) MEFs detected with anti-LSH and anti-HDAC1 antibodies. (B) South-Western assay with anti-5meC antibody on genomic DNA purified from wild-type and Hells−/− MEFs. (C) Quantification of the South-Western assay shown in B. Error bars, SD from the mean. (D) MBD affinity purification of methylated DNA from wild-type and Hells−/− MEFs. Input DNA and 5-methylcytosine (5-meC)-enriched MAP samples were labeled with Cy-dyes and cohybridized to a high-density oligonucleotide microarray representing all promoters of mouse RefSeq genes.
Figure 2.
Figure 2.
Loss and gain of DNA methylation in Hells−/− MEFs. (A) Scatter plots comparing average DNA methylation values (log2 MAP/input) from replicate microarrays for all 1-kb promoter regions (left) and 1-kb upstream regions (right) in wild-type (y-axis) versus Hells−/− MEFs (x-axis). The red spots indicate sequences showing more than twofold reduction ([log2 MAP/input WT] − [log2 MAP/input Hells−/−] ≥ 1) of DNA methylation in Hells−/− MEFs. The blue spots are sequences showing more than twofold gain ([log2 MAP/input Hells−/−] − [log2 MAP/input WT] ≥ 1) of DNA methylation in Hells−/− MEFs. “n” indicates the number of promoters/upstream regions displaying loss or gain of DNA methylation. “ρ” is the Spearman correlation coefficient. (B) Methylated promoters in wild-type and Hells−/− MEFs divided to low (LCP), intermediate (ICP), and high CpG density (HCP) promoters. The numbers and percentage of promoters in each class are indicated. (C,D) Loss of DNA methylation in Hells−/− MEFs at single genes (C) and clusters of neighboring genes (D). The gray boxes represent tiled 2.5-kb regions. The transcripts originating from these regions are shown above the gray boxes; TSSs are indicated by arrows. The scale represents log2 MAP/input values. The distances between individual promoters are shown in kilobytes. (E) Gain of DNA methylation at Dbt promoter on chromosome 3 in Hells−/− MEFs. (F) A histogram showing the number of LSH-dependent clusters and number of genes per cluster. (G) A heath map comparison of DNA methylation patterns between wild-type ES cells, wild-type MEFs, and Hells−/− MEFs. The three groups of LSH-dependent hypo- and hypermethylated promoters are indicated together with the most significant representative biological functions of the genes in each group (Gene Ontology, P < 0.0001).
Figure 3.
Figure 3.
DNA methylation of Rhox gene cluster is LSH-dependent. (A) Schematic representation of the Rhox gene cluster and neighboring genes on mouse chromosome X A.33. The light-colored genes are provisional or predicted RefSeq. The GC content of the region is shown as a histogram. (B) DNA methylation at the promoters of the Rhox genes and genes neighboring the Rhox cluster was examined by PCR following digestion with methylation-sensitive HpaII (H) or methylation insensitive MspI (M) restriction enzymes of genomic DNA from wild-type and Dnmt3a/3b−/− ES cells as well as wild-type and Hells−/− MEFs. “−” represents undigested DNA. “Mr” is a DNA size marker. (C) Bisulfite DNA sequencing confirms lack of DNA methylation at Rhox2a and Rhox9 promoters, but not at the Culin4b promoter in Hells−/− compared with the wild-type MEFs. Methylated CpGs are shown as black circles. The average percentage of methylated CpGs relative to the total number of CpGs investigated by bisulfite DNA sequencing for any given sequence is shown in parentheses.
Figure 4.
Figure 4.
Changes in gene expression in Hells−/− MEFs. (A) RT-PCRs detect expression of the normally silenced Gm9 and Rhox genes in Hells−/− MEFs. (B) Expression of the imprinted genes Mkrn3, Ndn, and Peg12 of the mouse PWS imprinted locus on chromosome 7 in Hells−/− and wild-type MEFs. Ube3a is a neighboring imprinted gene. (C) Pluripotency markers Dppa2 and Dppa4, but not Dppa3 and Gdf3, are expressed in Hells−/− MEFs. (D) As previously reported (Xi et al. 2007), some Hox genes, including Hoxa5, Hoxa6, and Hoxa7, are aberrantly expressed in Hells−/− MEFs. In A–D, the triangles represent an increasing concentration of cDNA. “Mr” is a DNA size marker. (E) Global changes in gene expression in Hells−/− MEFs compared with wild-type controls as detected by expression microarrays. “n” indicates the number of up-regulated fourfold or more (log2 Hells−/−/wild type ≥ 2) and down-regulated fourfold or more (log2 wild type/Hells−/− ≥ 2) transcripts. Log2 values of normalized intensities for Hells−/− MEFs (y-axis) versus wild-type MEFs (x-axis) are shown.
Figure 5.
Figure 5.
The Rhox and other LSH-dependent loci are hypomethylated in Ehmt2−/− ES cells. (A) Western blots show G9a, LSH, and HDAC1 in nuclear extracts from wild-type and mutant ES cells and MEFs. (B) Western blots for H3K9me1, H3K9me2, and H3K9me3 in wild-type and mutant ES cells and MEFs. “Ehmt2−/− Tg” indicates Ehmt2−/− (G9a-null) cells expressing catalytically inactive Ehmt2 (G9a) transgene. (C) ELISA assays with anti-5meC antibody on genomic DNA purified from wild-type and mutant ES cells and MEFs. Note than Hells−/− MEFs and Ehmt2−/− ES cells have comparable amounts of 5-meC. Catalytically inactive Ehmt2 transgene partially rescues DNA methylation defects in Ehmt2−/− ES cells. (D,E) Methylation-sensitive PCR (D) and bisulfite sequencing (E) detect loss of DNA methylation at Rhox and other LSH-dependent promoters in Ehmt2−/− ES cells. DNA methylation is partly restored in Ehmt2−/− cells expressing catalytically inactive Ehmt2 transgene (Tg). MspI and HpaII digested genomic DNA is indicated by “M” and “H,” respectively. “Mr” is DNA size marker. In F, methylated CpGs are shown as black circles. The percentage of methylated CpGs relative to the total number of CpGs investigated by bisulfite sequencing for any given sequence is shown in parentheses. (F) A Venn diagram showing the overlap between hypomethylated (relative to ES cells and MEFs, group I) promoters in Hells−/− MEFs and hypomethylated loci in Ehmt2−/− ES cells.
Figure 6.
Figure 6.
H3K9me2 and G9a/GLP are absent from Rhox and other promoters in Hells−/− MEFs. (A,B) ChIP experiments detect loss of G9a and GLP binding (gray bars) from the promoters of Rhox2, Rhox6/9, Rhox11, Elf5 and Wfdc15 in Hells−/− compared with wild-type (WT) MEFs. The promoter of the expressed Ndufa1 gene was used as a control. Total mouse IgG served as a nonspecific control antibody (white bars). (C,D) ChIP assays detect loss of H3K9me2 (C) and gain of H3 K9/K14 acetylation at Rhox, Elf5, and Wfdc15 promoters in Hells−/− MAFs. All graphs show the average enrichment ± SD from two independent chromatin preparations and ChIP experiments performed and analyzed in triplicate.
Figure 7.
Figure 7.
LSH is required for recruitment of G9a to promoters of pluripotency genes during differentiation. (A) Western blots display G9a, LSH, HDAC1, and DNMT3B protein levels in shScr and shLsh ES cells during differentiation to embryoid bodies (EB) at days 2, 4, and 6. (B) Fold down-regulation of pluripotency markers mRNA as detected by qRT-PCR in wild-type and mutant EBs at day 8 relative to ES cells. (C) mRNA expression ratios relative to GAPDH of pluripotency genes in shScr versus shLsh ES cells and EBs at day 8 of differentiation indicate that these genes have equal expression in shScr and shLsh ES cells, but higher expression in shLsh EB8 relative to shScr EB8. (D) mRNA expression ratios relative to GAPDH of pluripotency genes in wild-type versus Ehmt2−/− (G9a-null) ES cells and EB at day 8. (E) ChIP for acetylated H3, H3K9me2, and G9a at promoters of pluripotency genes in shScr and shLsh EBs at day 8 of differentiation. Ndf is a control promoter of constitutively expressed Ndufa1 gene. (F) ChIP for acetylated H3, H3K9me2, and G9a at promoters of pluripotency genes in wild-type and Ehmt2−/− EBs at day 8 of differentiation. In E and F, the scale on the left applies to H3ac and H3K9me2; the scale on the right applies to G9a. (G,H) ChIP enrichment profiles of acetylated H3, H3K9me2, LSH, and G9a at the promoter of the Dppa4 gene during differentiation of shScr and shLsh ES cells. The scale on the left applies to H3ac and H3K9me2; the scale on the right applies to LSH, G9a, and the nonspecific IgG.

References

    1. Athanasiadou R, de Sousa D, Myant K, Merusi C, Stancheva I, Bird A 2010. Targeting of de novo DNA methylation throughout the Oct-4 gene regulatory region in differentiating embryonic stem cells. PLoS ONE 5: e9937 doi: 10.1371/journal.pone.0009937 - PMC - PubMed
    1. Becker PB, Horz W 2002. ATP-dependent nucleosome remodeling. Annu Rev Biochem 71: 247–273 - PubMed
    1. Bird A 2002. DNA methylation patterns and epigenetic memory. Genes Dev 16: 6–21 - PubMed
    1. Brzeski J, Jerzmanowski A 2003. Deficient in DNA methylation 1 (DDM1) defines a novel family of chromatin-remodeling factors. J Biol Chem 278: 823–828 - PubMed
    1. Cross SH, Charlton JA, Nan X, Bird AP 1994. Purification of CpG islands using a methylated DNA binding column. Nat Genet 6: 236–244 - PubMed

Publication types

LinkOut - more resources