

Heterogeneity of the phenotypic definition of coronary artery disease and its impact on genetic association studies
- PMID: 21149552
- PMCID: PMC3048058
- DOI: 10.1161/CIRCGENETICS.110.957738
Heterogeneity of the phenotypic definition of coronary artery disease and its impact on genetic association studies
Abstract
Background: Variability in phenotypic characterization of coronary artery disease (CAD) may contribute to the heterogeneity of genetic association studies, and more consistency in phenotype definitions might improve replication of genetic associations. We assessed the extent of phenotypic heterogeneity and quantified its impact in a large literature sample of association studies.
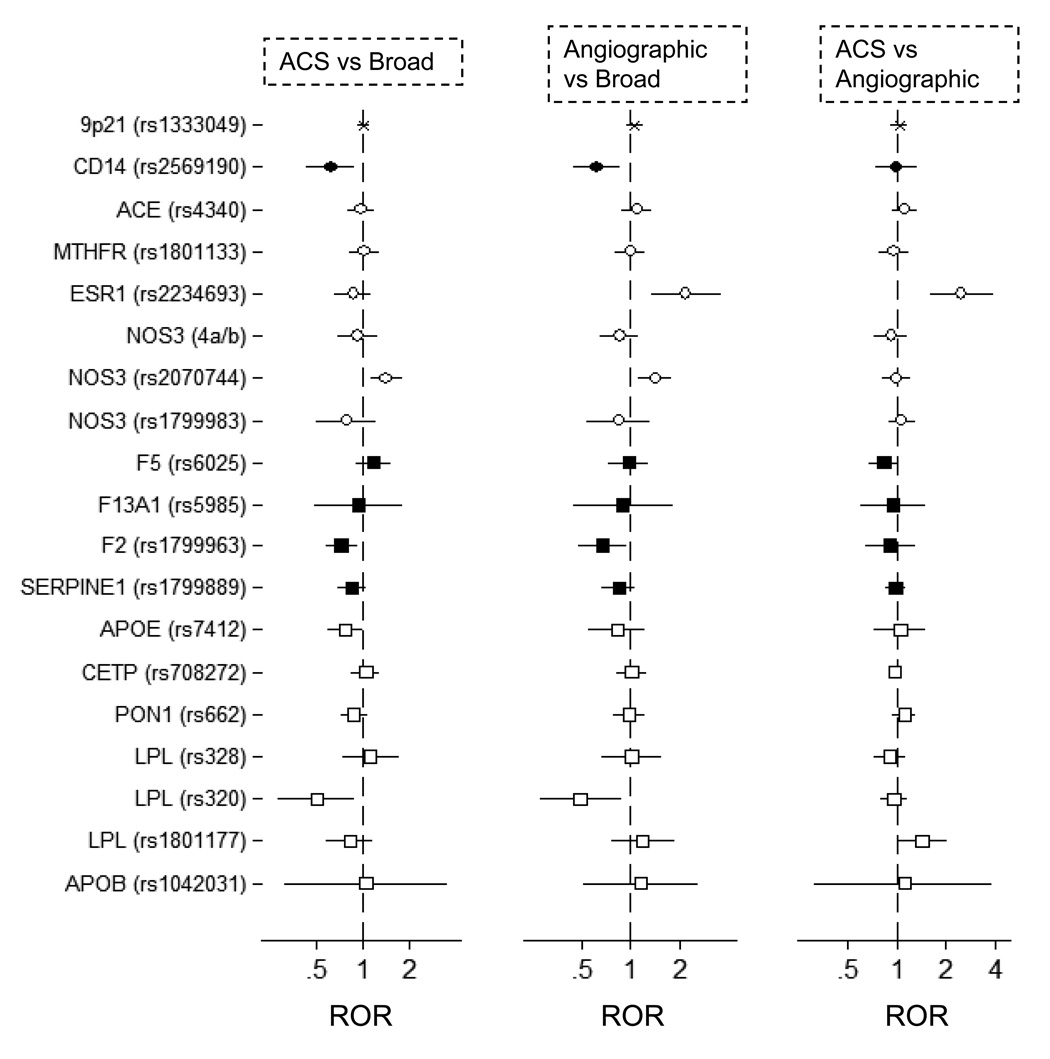
Methods and results: We searched for large (≥15 studies) meta-analyses of genetic associations and reviewed all studies included therein. From each primary study, we extracted phenotypic definitions, demographics, study design characteristics, and genotypic data. For each association, we assessed the magnitude and heterogeneity of genetic effects within and across CAD phenotypes, using meta-analytic methodologies. A total of 965 individual studies investigating 32 distinct variants in 22 genes were included, from which we grouped CAD phenotypes into 3 categories: acute coronary syndromes (ACS) (426 [44%] studies); angiographically documented disease (323 [34%] studies); and broad, not otherwise specified CAD (216 [22%] studies). These clinical phenotypes were overlapping. Subgroup meta-analyses by phenotype showed discordant results, but phenotypic classification generally explained small proportions of between-study heterogeneity. Differences between phenotypic groups were minimized for associations with robust statistical support. No CAD phenotype was consistently associated with larger or more homogeneous genetic effects in meta-analyses.
Conclusions: Substantial phenotypic heterogeneity exists in CAD genetic associations, but differences in phenotype definition make a small contribution to between-study heterogeneity. We did not find a consistent effect in terms of the magnitude or homogeneity of summary effects for a specific phenotype to support its preferential use in genetic studies or meta-analyses for CAD.
Figures


Comment in
-
Genomic reflections of coronary artery disease.Circ Cardiovasc Genet. 2011 Feb;4(1):7-8. doi: 10.1161/CIRCGENETICS.110.959163. Circ Cardiovasc Genet. 2011. PMID: 21325163 No abstract available.
References
-
- Damani SB, Topol EJ. Future use of genomics in coronary artery disease. J Am Coll Cardiol. 2007;50:1933–1940. - PubMed
-
- Dandona S, Roberts R. Genomic view of factors leading to plaque instability. Curr Cardiol Rep. 2009;11:282–287. - PubMed
-
- Ginsburg GS, Shah SH, McCarthy JJ. Taking cardiovascular genetic association studies to the next level. J Am Coll Cardiol. 2007;50:930–932. - PubMed
-
- Morgan TM, Krumholz HM, Lifton RP, Spertus JA. Nonvalidation of reported genetic risk factors for acute coronary syndrome in a large-scale replication study. JAMA. 2007;297:1551–1561. - PubMed
-
- Mayer B, Erdmann J, Schunkert H. Genetics and heritability of coronary artery disease and myocardial infarction. Clin Res Cardiol. 2007;96:1–7. - PubMed
Publication types
MeSH terms
Grants and funding
LinkOut - more resources
Full Text Sources
Medical
Miscellaneous
