. 2010 Dec 13;191(6):1141-58.
doi: 10.1083/jcb.201007152.

Mff is an essential factor for mitochondrial recruitment of Drp1 during mitochondrial fission in mammalian cells

Affiliations

Mff is an essential factor for mitochondrial recruitment of Drp1 during mitochondrial fission in mammalian cells

Hidenori Otera et al. J Cell Biol. .

Abstract

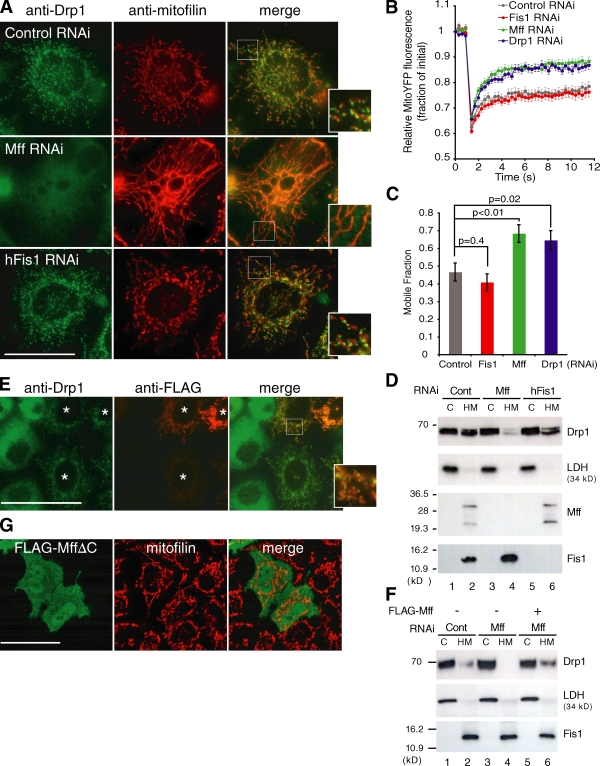
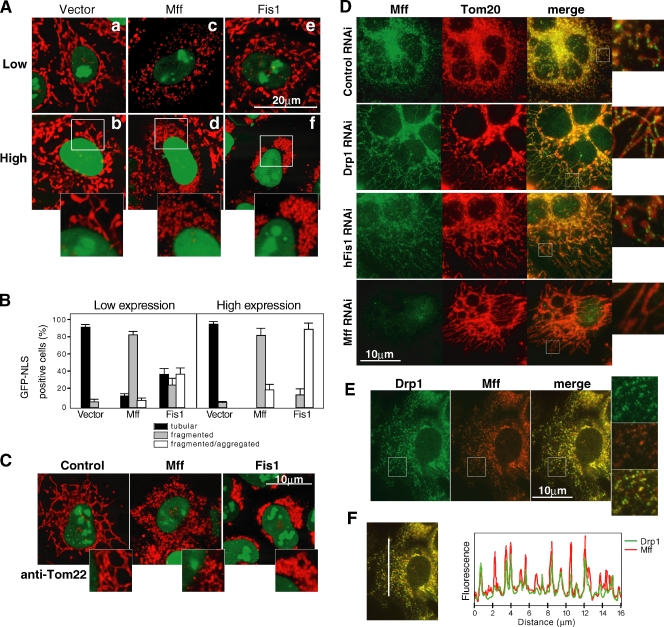
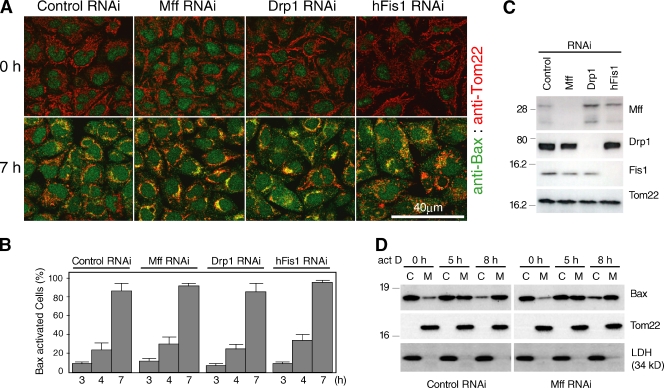
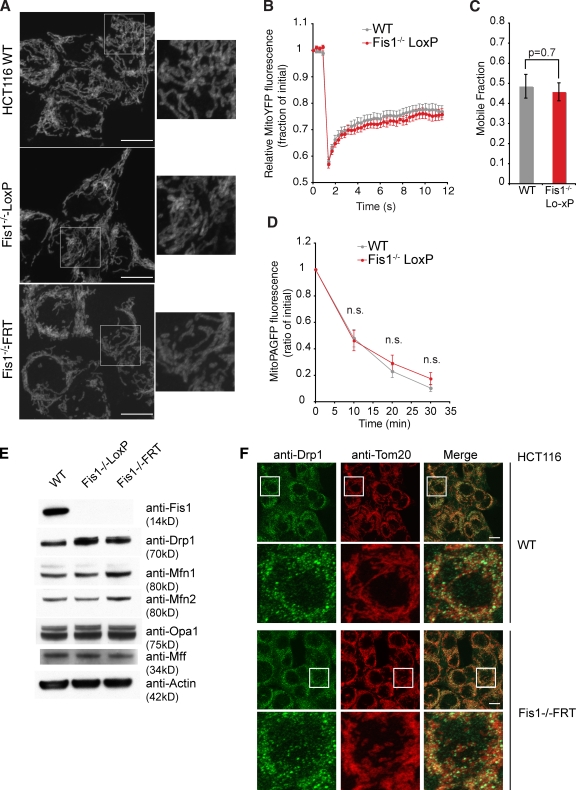
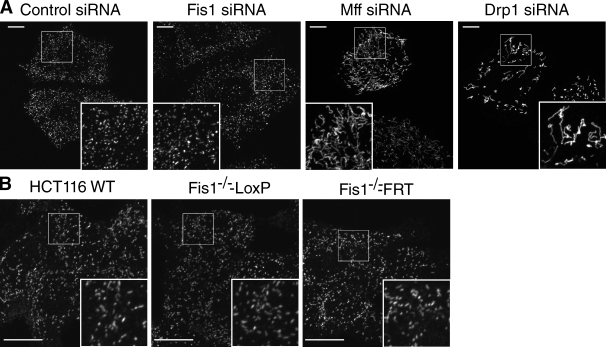
The cytoplasmic dynamin-related guanosine triphosphatase Drp1 is recruited to mitochondria and mediates mitochondrial fission. Although the mitochondrial outer membrane (MOM) protein Fis1 is thought to be a Drp1 receptor, this has not been confirmed. To analyze the mechanism of Drp1 recruitment, we manipulated the expression of mitochondrial fission and fusion proteins and demonstrated that (a) mitochondrial fission factor (Mff) knockdown released the Drp1 foci from the MOM accompanied by network extension, whereas Mff overexpression stimulated mitochondrial recruitment of Drp1 accompanied by mitochondrial fission; (b) Mff-dependent mitochondrial fission proceeded independent of Fis1; (c) a Mff mutant with the plasma membrane-targeted CAAX motif directed Drp1 to the target membrane; (d) Mff and Drp1 physically interacted in vitro and in vivo; (e) exogenous stimuli-induced mitochondrial fission and apoptosis were compromised by knockdown of Drp1 and Mff but not Fis1; and (f) conditional knockout of Fis1 in colon carcinoma cells revealed that it is dispensable for mitochondrial fission. Thus, Mff functions as an essential factor in mitochondrial recruitment of Drp1.


Figures

Figure 1.
Figure 1.
Mff siRNA compromises mitochondrial localization of Drp1. (A) Control, Mff, or Fis1 RNAi HeLa cells were analyzed by immunofluorescence microscopy using anti-Drp1 antibody (green) and antimitofilin antibodies (red). Magnified images are shown in insets. (B and C) Mitochondrial network connectivity in either control, Fis1, Mff, or Drp1 RNAi HeLa cells transfected with mito-YFP. In brief, a 2.1-µm circle containing multiple mitochondria was photobleached and monitored for recovery (Fig. S2). The normalized and photobleach corrected curves (B) or mobile fractions (C) represent the mean ± SEM of 60 individual FRAP curves from two independent experiments (30 FRAP curves per experiment). The results were analyzed by the Student’s t test, and p-values are noted on the figure. (D) HeLa cells transfected with the indicated siRNAs were fractionated into cytosol (C) and heavy membrane (HM) fractions, which were analyzed by Western blotting using the indicated antibodies (cytosol/heavy membrane = 1:5 in volume equivalents). Five times the volume equivalent of heavy membrane fraction versus cytosol fraction was loaded to show the difference on mitochondrial recruitment of Drp1 in control (Cont) and Mff RNAi cells. Lactate dehydrogenase (LDH) is a cytosolic marker. (E) Mff RNAi cells were transfected with FLAG-Mff and subjected to immunostaining with anti-Drp1 (green) and anti-FLAG (red) antibodies. Asterisks indicate FLAG-Mff–expressing cells. (F) HeLa cells subjected to the indicated manipulations were fractionated and analyzed as in D. Cytosol/heavy membrane = 1:3 in volume equivalents. (G) FLAG-Mff mutant lacking a TMD (MffΔC) was expressed in HeLa cells. After incubation for 24 h, the cells were fixed and immunostained with anti-FLAG antibody (green) and antimitofilin antibodies (red). Bars, 20 µm.
Figure 2.
Figure 2.
Mff and Drp1 colocalize in puncta on mitochondria. (A) Mff overexpression leads to mitochondrial fragmentation. HeLa cells stably expressing Su9-DsRed were transfected with pMff-IRES-GFP-NLS, phFis1-IRES-GFP-NLS, or empty vector and subjected to live imaging by confocal microscopy. Top and bottom images show the cells expressing low and high levels of nuclear GFP, respectively. Typical images are shown in insets at high magnification. (B) Percentages of cells with indicated mitochondrial morphologies in cells (n = 100) transfected with indicated plasmids at 24 h after transfection. Data were collected from three independent experiments and represent the mean ± SD. (C) HeLa cells manipulated as in A were immunostained with anti-Tom22 antibodies (red). The insets show magnified images of the mitochondrial regions. (D) Immunofluorescence microscopy of endogenous Mff in HeLa cells transfected with the indicated siRNA immunostained with anti-Mff (green) and anti-Tom20 (red). (E and F) HeLa cells were immunostained with anti-Drp1 (green) and anti-Mff (red) antibodies. (F) A line scan (shown in the vertical line) plot of relative fluorescence intensities of Mff and Drp1 in the indicated images (same as in E) was analyzed using AxioVision 4.7.1 software (Carl Zeiss, Inc.). The insets in D and E show magnified images of the squared regions.
Figure 3.
Figure 3.
Mff interacts with Drp1 both in vivo and in vitro. (A) HeLa cells stably expressing FLAG-Drp1 were transfected with the indicated siRNA and further transfected with phFis1-IRES-GFP-NLS (b) and pMff-IRES-GFP-NLS (c and d). After 24 h, the cells were fixed and immunostained with anti-FLAG antibodies (red). (B) HeLa cells stably expressing FLAG-Drp1 were transfected with HA-Mff. After 24 h, the cells were immunostained with anti-HA antibodies (green) and anti-FLAG antibodies (red). High magnification images (insets) show colocalization of FLAG-Drp1 and HA-Mff. (C) HeLa cells were transfected with Mff siRNA and further transfected with FLAG-Mff-CAAX. The cells were immunostained with antibodies against Drp1 (green) and FLAG (red). Asterisks show FLAG-Mff-CAAX–nonexpressing cells. The insets show magnified images of the squared regions. (D) HeLa cells expressing the indicated proteins were treated with DSP, solubilized either with digitonin buffer (mild condition) or with SDS buffer (stringent condition), and subjected to immunoprecipitation (IP) using anti-FLAG antibody (see Materials and methods). Asterisk shows IgG light chain. IB, immunoblot. (E) Purified proteins were mixed in the indicated combinations and treated with 1 mM DSP. The reaction mixtures were solubilized with 1% Triton X-100 and subjected to immunoprecipitation with anti-Drp1 antibodies. See Materials and methods for details. (F) pMff-IRES-GFP-NLS was cotransfected with HA-WT-Drp1 or HA-Drp1-A395D into HeLa cells, and the cells were analyzed by immunofluorescence microscopy using anti-HA antibodies (red). Note that HA-WT-Drp1, but not HA-Drp1-G395A, was targeted to mitochondria in the Mff-expressing cells. (G) The cells (n = 200) for HA-WT-Drp1 and HA-Drp1-A395D with the cytosol- or mitochondria-localized pattern of Drp1 in A were quantified. vec, vector. (H) The cells treated as in F were analyzed by immunofluorescence microscopy using anti-Tom22. (I) Percentages of cells (n = 200) for HA-WT-Drp1, HA-Drp1-A395D, and HA-Drp1-K38A with the indicated mitochondrial morphology in H. Data were collected from three independent experiments and represent mean ± SD.
Figure 4.
Figure 4.
N-terminal cytosolic region is required for the recruitment of Drp1 to mitochondria. (A) Schematic representation of Mff deletion constructs, and summary of their expression effects on the recruitment and intracellular localization of Drp1 in Mff RNAi cells. Yellow box, TMD from Omp25. Mt, mitochondria. Cyto, cytoplasm. (B) Mff mutants were expressed in Mff RNAi cells and analyzed by immunofluorescence microscopy with anti-Drp1 (green) and anti-FLAG antibodies (red). The insets show magnified images of the mitochondrial regions. (C) Percentages of cells with the indicated mitochondrial morphologies in HeLa cells expressing various Mff deletion mutants as in B. 200 cells in each of three independent experiments were counted. Data represent mean ± SD.
Figure 5.
Figure 5.
Mff-induced mitochondrial fission depends on Drp1. (A) FLAG-Mff was transfected in WT or Drp1−/− MEFs. After 36 h, the cells were fixed and immunostained with anti-Tom70 antibodies (green) and anti-FLAG antibodies (red). (B) Percentage of cells with tubular and fragmented mitochondria. Three distinct fields for each 100 cells were counted. Data represent mean ± SD. (C) HeLa cells stably expressing Su9-DsRed were transfected with the indicated siRNA and further transfected with pMff-IRES-GFP-NLS. Live images were obtained by confocal microscopy. (D) HeLa cells in C were subjected to immunoblot analysis using the indicated antibodies with mitofilin as a loading control. Molecular mass is given in kilodaltons. (E) Percentages of cells (n = 100) with the indicated mitochondrial morphologies in mock- and Mff-transfected cells at 24 h after transfection. Data were obtained from three independent experiments and represent mean ± SD.
Figure 6.
Figure 6.
Depletion of Mff, but not hFis1, blocks Opa1 RNAi–induced extensive mitochondrial fragmentation and increased hypersensitivity to apoptosis. (A) HeLa cells stably expressing Su9-DsRed were transfected with the indicated siRNA. Live images were obtained by fluorescence microscopy (a–e magnified images are shown as insets in b and e). EM of these manipulated cells are shown in f–j. (B) Onionlike mitochondrial inner membrane structures in Opa1/Drp1 and Opa1/Mff double knockdown cells. (C) Percentages of cells with the indicated mitochondrial morphologies in various RNAi cells. Data were obtained from 100 cells in each of three independent experiments and represent mean ± SD. (D) HeLa cells were transfected with the indicated siRNA and then treated with actinomycin D in the presence of Z-VAD-FMK. Cells were fixed at the indicated time points, and cytochrome c release was detected by immunostaining. Data were obtained from 300 cells in each of three independent experiments and represent mean ± SD.
Figure 7.
Figure 7.
Inhibition of Mff does not affect Bax activation during apoptosis. (A) HeLa cells were transfected with the indicated siRNAs and then treated with actinomycin D (act D) in the presence of Z-VAD-FMK. The cells were immunostained with anti-Bax antibody (green) and anti-Tom22 antibody (red). (B) Time course of Bax activation. HeLa cells (n = 300) in A with mitochondria-targeted Bax were counted in three distinct fields, and data represent mean ± SD. (C) Cells in A were subjected to immunoblot analysis using the indicated antibodies. (D) Mff RNAi HeLa cells in A were fractionated to cytosol (C) and membrane (M) fractions, which were subjected to immunoblot analysis using the indicated antibodies. LDH, lactate dehydrogenase. Molecular mass is given in kilodaltons.
Figure 8.
Figure 8.
Characterization of mitochondrial morphology in Fis1 CKO cells. (A) Comparison of mitochondrial morphology in WT and Fis1 CKO cells immunostained with anti-Tom20 antibody. (B and C) The mitochondrial network connectivity assay showing FRAP curves (B) or mobile fractions (C) from either WT or Fis1−/−-LoxP HCT116 cells was performed as in Fig. 1 (B and C). (D) Mitochondrial fusion rate in either WT or Fis1−/−-LoxP HCT116 cells. A 1.88-µm circle containing multiple mitochondria was activated with a 413-nm laser, and images were acquired at 0, 10, 20, and 30 min after activation using the 488-nm laser. The fraction of remaining activated mitochondria was quantified using MetaMorph software (MDS Analytical Technologies). The mean ± SEM of 23 distinct photoactivated regions is plotted and is representative of three independent experiments. MitoPAGFP, mito-photoactivatable GFP. n.s., not significant. (E) Comparison of mitochondrial fission and fusion protein levels in WT and two sets of Fis1 CKO cells. (F) Drp1 subcellular localization in Fis1 CKO cells. In A and F, magnified images of the squared regions are shown. Bars, 10 µm.
Figure 9.
Figure 9.
Off-target effect of Fis1 RNAi on mitochondrial morphology. (A) Fis1 and Drp1 protein levels in the indicated RNAi cells. (B) Comparison of mitochondrial morphology in WT, Fis1 CKO, and the indicated RNAi cells. Cells were immunostained with anti–cytochrome c antibody. (C and D) Comparison of mitochondrial morphology in lentivirus-infected control RNAi or Fis1 RNAi HeLa (C) or HCT116 (D) cells immunostained with anti-Tom20 antibody. Knockdown level of each Fis1 shRNA was indicated by Western blotting. The insets show magnified images of the squared regions. Bars, 10 µm.
Figure 10.
Figure 10.
Mff, but not hFis1, affects peroxisomal morphology. (A) HeLa cells were transfected with the indicated siRNAs, and peroxisome morphology was revealed by immunostaining with anti-PMP70 antibody. (B) Peroxisome morphology in WT and Fis1 CKO cells was detected as in A. The insets show magnified images of the squared regions. Bars, 10 µm.

References

    1. Alexander C., Votruba M., Pesch U.E., Thiselton D.L., Mayer S., Moore A., Rodriguez M., Kellner U., Leo-Kottler B., Auburger G., et al. 2000. OPA1, encoding a dynamin-related GTPase, is mutated in autosomal dominant optic atrophy linked to chromosome 3q28. Nat. Genet. 26:211–215 10.1038/79944 - DOI - PubMed
    1. Arnoult D. 2007. Mitochondrial fragmentation in apoptosis. Trends Cell Biol. 17:6–12 10.1016/j.tcb.2006.11.001 - DOI - PubMed
    1. Benard G., Karbowski M. 2009. Mitochondrial fusion and division: regulation and role in cell viability. Semin. Cell Dev. Biol. 20:365–374 10.1016/j.semcdb.2008.12.012 - DOI - PMC - PubMed
    1. Breckenridge D.G., Kang B.H., Kokel D., Mitani S., Staehelin L.A., Xue D. 2008. Caenorhabditis elegans drp-1 and fis-2 regulate distinct cell-death execution pathways downstream of ced-3 and independent of ced-9. Mol. Cell. 31:586–597 10.1016/j.molcel.2008.07.015 - DOI - PMC - PubMed
    1. Cerveny K.L., Studer S.L., Jensen R.E., Sesaki H. 2007a. Yeast mitochondrial division and distribution require the cortical num1 protein. Dev. Cell. 12:363–375 10.1016/j.devcel.2007.01.017 - DOI - PubMed

Publication types