. 2010 Dec 13;191(6):1173-87.
doi: 10.1083/jcb.201006131.

RNAi screen identifies a role for adaptor protein AP-3 in sorting to the regulated secretory pathway

Affiliations

RNAi screen identifies a role for adaptor protein AP-3 in sorting to the regulated secretory pathway

Cédric S Asensio et al. J Cell Biol. .

Abstract

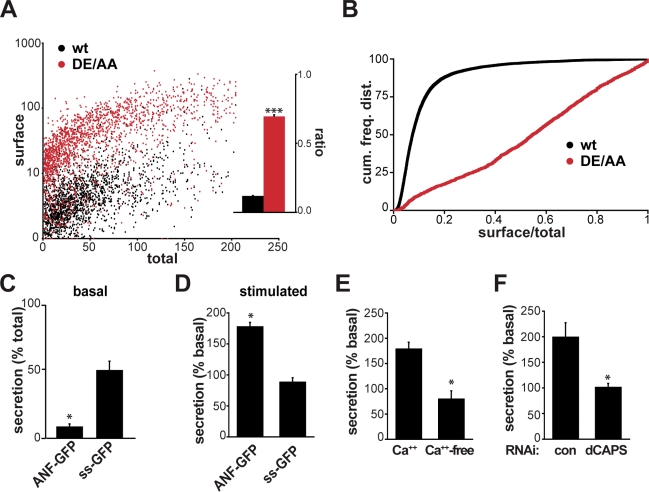
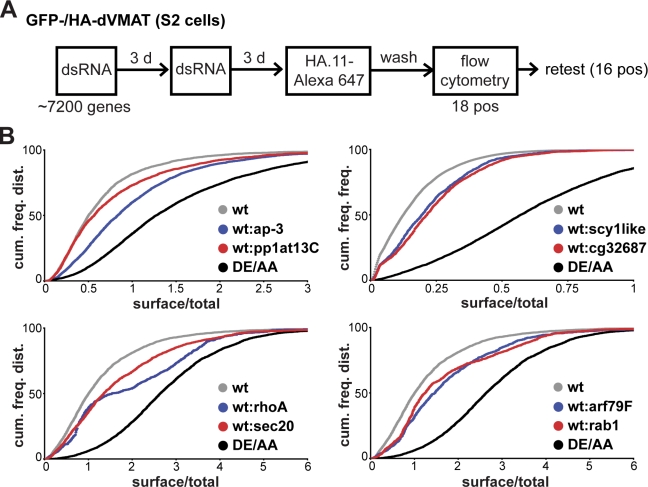
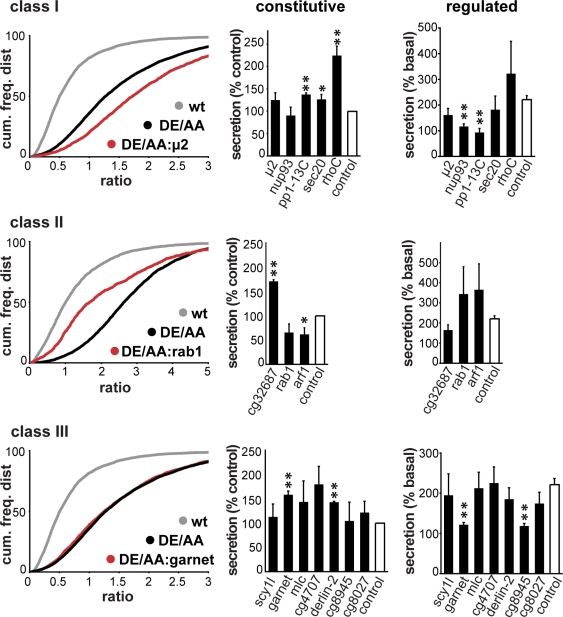
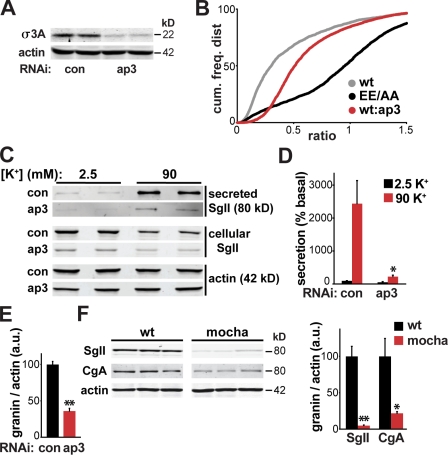
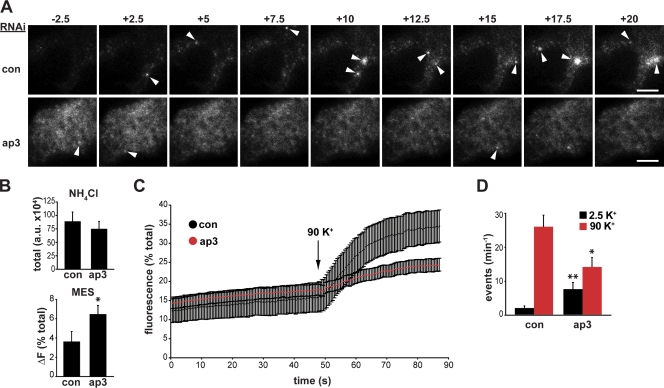
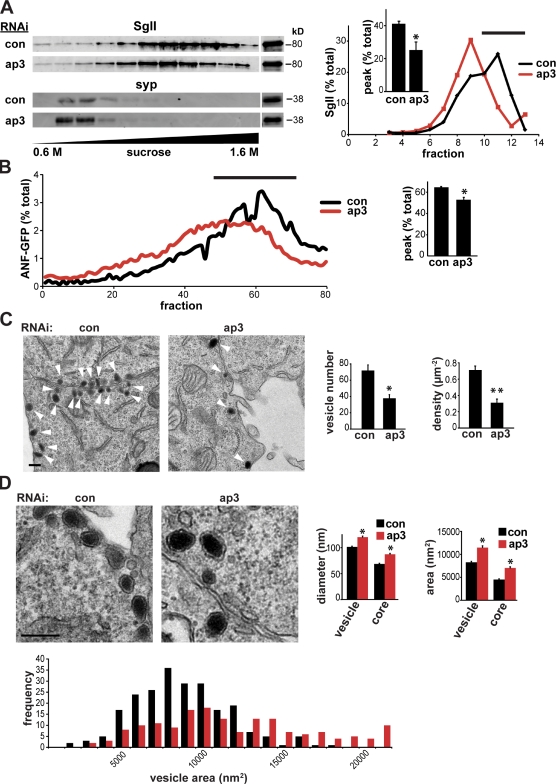
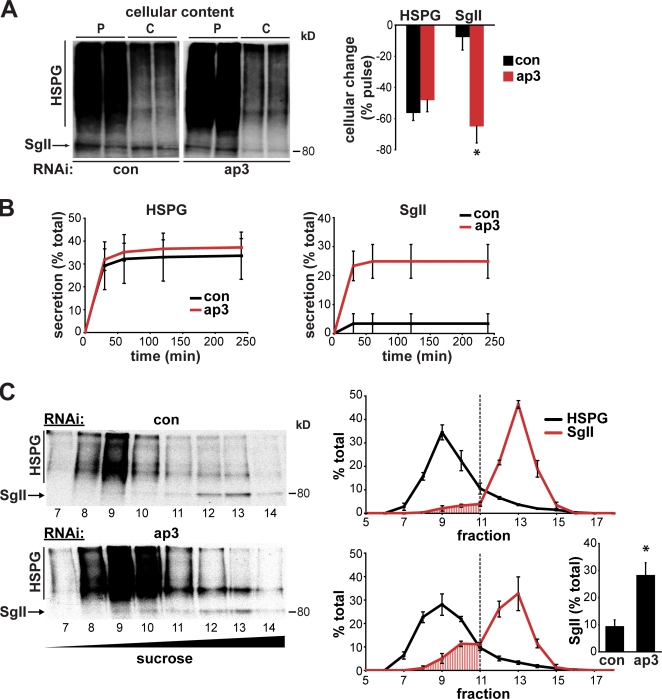
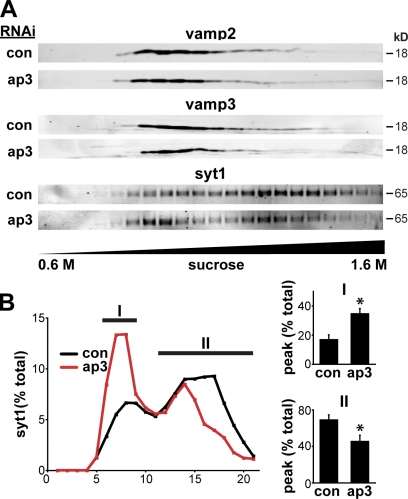
The regulated release of proteins depends on their inclusion within large dense-core vesicles (LDCVs) capable of regulated exocytosis. LDCVs form at the trans-Golgi network (TGN), but the mechanism for protein sorting to this regulated secretory pathway (RSP) and the cytosolic machinery involved in this process have remained poorly understood. Using an RNA interference screen in Drosophila melanogaster S2 cells, we now identify a small number of genes, including several subunits of the heterotetrameric adaptor protein AP-3, which are required for sorting to the RSP. In mammalian neuroendocrine cells, loss of AP-3 dysregulates exocytosis due to a primary defect in LDCV formation. Previous work implicated AP-3 in the endocytic pathway, but we find that AP-3 promotes sorting to the RSP within the biosynthetic pathway at the level of the TGN. Although vesicles with a dense core still form in the absence of AP-3, they contain substantially less synaptotagmin 1, indicating that AP-3 concentrates the proteins required for regulated exocytosis.


Figures

Figure 1.
Figure 1.
S2 cells express an RSP. (A and B) S2 cells were transiently transfected with wt (black) or DE/AA (red) GFP- and HA-tagged dVMAT, incubated for 2 h at room temperature with external HA antibody conjugated to Alexa Fluor 647, washed, and the fluorescence of individual cells was determined by flow cytometry (A). (inset) The bar graph displays the mean ratio of surface/total fluorescence (n > 1,800 cells). Kolmogorov-Smirnov analysis of the cumulative frequency distributions binned by surface/total dVMAT ratios (B) indicates a significant change in the DE/AA distribution relative to wt (***, P < 10−14). (C–F) S2 cells were transiently transfected with ANF-GFP (C–E) or the signal sequence of ANF fused directly to GFP (ss-GFP; C and D), washed, incubated for 1 h, and the cellular and secreted GFP fluorescence were measured using a plate reader. (C) Normalized to intracellular fluorescence, the media of cells expressing ANF-GFP shows less fluorescence than cells expressing ss-GFP. (D) Treatment with 100 µg/ml LPS induces secretion of ANF-GFP but not ss-GFP. (E and F) Pretreatment with BAPTA-AM in calcium-free buffer (E) or knockdown of Drosophila calcium-dependent activator protein for secretion (dCAPS) with dsRNA (F) block the secretion evoked by LPS. *, P < 0.05 by two-tailed Student’s t test. The data represent mean values from three to four independent experiments, and error bars indicate SEM.
Figure 2.
Figure 2.
S2 cell screen identifies genes that regulate the surface expression of dVMAT. (A) The flow chart illustrates the procedure used for screening. S2 cells transfected with GFP-/HA-dVMAT were treated twice with dsRNA over a 6-d period in a 96-well plate, incubated with external HA antibody conjugated to Alexa Fluor 647 for 2 h, washed, and the fluorescence of both GFP and Alexa Fluor 647 was measured at the level of individual cells by flow cytometry. Of 7,200 genes conserved from Drosophila to mammals, 18 positives (z score ≥ 3) were identified and retested using nonoverlapping dsRNA. Kolmogorov-Smirnov analysis of the cumulative frequency distribution reveals that 16 of 18 genes were again positive (P < 0.005 in at least two independent experiments). (B) Cumulative frequency distributions for selected dsRNA in representative retest experiments show the differences from control (wt) and DE/AA dVMAT.
Figure 3.
Figure 3.
Classification of genes identified in the screen by mechanism and effect on the regulated secretion of soluble cargo. S2 cells transfected with DE/AA GFP-/HA-dVMAT were treated with dsRNA-targeting genes identified in the screen, and the uptake of external HA antibody was measured as described in Fig. 1. (left) Representative cumulative frequency distributions are shown for selected genes in each class. Class I genes increase, class II genes decrease, and class III genes have no effect on antibody uptake by DE/AA dVMAT. (middle) S2 cells expressing ANF-GFP were treated with dsRNA and basal (unstimulated) secretion of GFP fluorescence determined as in Fig. 1 C. Secretion was normalized to cellular ANF-GFP and expressed as a percentage of the fluorescence secreted by control cells. (right) S2 cells expressing ANF-GFP were treated with dsRNA and LPS-induced secretion measured as in Fig. 1 D. *, P < 0.05; **, P < 0.01 (relative to control by two-tailed Student’s t test; n = 3–5). The data show mean values, and error bars indicate SEM.
Figure 4.
Figure 4.
AP-3 RNAi increases VMAT2 surface expression and impairs regulated release of SgII from PC12 cells. (A and B) Western analysis of extracts from PC12 cells transiently transfected with 50 nM AP-3 siRNA show an ∼80% reduction in AP-3δ subunit σ3A relative to cells transfected with control siRNA (A). PC12 cells cotransfected with wt or EE/AA GFP-/HA-VMAT2 with or without AP-3δ siRNA were subjected to flow cytometry as described in Fig. 1 B. Kolmogorov-Smirnov analysis of the cumulative frequency distributions for wt VMAT2 + control siRNA (gray), wt VMAT2 + AP-3δ siRNA (red), and EE/AA VMAT2 + control siRNA (black) indicates a significant change in the AP-3 siRNA distribution relative to wt (P < 10−14). (C and D) PC12 cells were transiently transfected with AP-3δ or control siRNA, washed, and incubated for 30 min in Tyrode’s solution containing 2.5 mM (basal) or 90 mM (stimulated) K+. Cellular and secreted SgII were measured by quantitative fluorescent immunoblotting (C), with the secreted SgII normalized to basal secretion in the control (D). AP-3δ RNAi greatly reduces the depolarization-induced secretion of SgII. *, P < 0.05 relative to stimulated secretion from control by two-tailed Student’s t test (n = 4). (E) AP-3δ RNAi reduces the cellular content of SgII relative to actin. *, P < 0.005 relative to control by two-tailed Student’s t test (n = 4). (F) The adrenal glands of mocha mice lacking AP-3 show a dramatic reduction in the content of SgII and chromogranin A (CgA) relative to the adrenals of control littermates. *, P < 0.05; **, P < 0.005 (relative to wt by two-tailed Student’s t test; n = 3). The data show mean values, and error bars indicate SEM.
Figure 5.
Figure 5.
AP-3 RNAi dysregulates the exocytosis of VMAT2. PC12 cells were transfected with 50 nM AP-3δ or control siRNA, cotransfected 2 d later with the same siRNA and VMAT2 containing a lumenal pHluorin (VMAT2-pHluorin), then imaged live by TIRF microscopy after an additional 2 d. Basal exocytosis of VMAT2-pHluorin was measured in Tyrode’s solution containing 2.5 mM K+, and release was stimulated in Tyrode’s with 90 mM K+ for 60 s. (A) Representative images acquired before and after depolarization show increased baseline fluorescence and fewer stimulated events (arrowheads) after transfection with AP-3 siRNA (Videos 1 and 2). (B) Total VMAT2 fluorescence was revealed by alkalinization in Tyrode’s solution containing 50 mM NH4Cl, pH 7.4 (top), and surface VMAT2-pHluorin revealed by acidification in Tyrode’s with 25 mM MES, pH 6.5 (bottom). AP-3δ RNAi increases the surface fraction of VMAT2 in cells despite expression equivalent to transfection with control siRNA. *, P < 0.05 relative to control by two-tailed Student’s t test (n = 12 for control and 14 for AP-3 siRNA). (C) Whole cell fluorescence expressed as a percentage of total fluorescence (revealed in NH4Cl) shows a robust response to depolarization with 90 mM K+ (arrow) in control cells but a greatly impaired response after AP-3 siRNA. The traces indicate the mean values of 12 individual traces for control and 14 for AP-3 RNAi cells. (D) The quantification of individual exocytotic events shows increased basal VMAT2-pHluorin exocytosis with AP-3 RNAi but a reduction in stimulated exocytosis. *, P < 0.02; **, P < 0.002 (relative to control by two-tailed Student’s t test; control, n = 31; AP-3, n = 19). Error bars indicate SEM. Bars, 5 µm.
Figure 6.
Figure 6.
AP-3 RNAi affects the properties of LDCVs. (A and B) PC12 cells were transfected twice with 50 nM AP-3δ or control siRNA, and the postnuclear supernatant (input) obtained 2–3 d after the second transfection was separated by equilibrium sedimentation through 0.6–1.6 M sucrose. Fractions were collected from the top of the gradient and assayed for synaptophysin (syp) and SgII by quantitative fluorescent immunoblotting, with each fraction expressed as the percentage of total gradient immunoreactivity, and the area under the LDCV peak (black lines) expressed as a percentage of the area under the entire curve (inset). (A) AP-3 RNAi greatly reduces the LDCV peak and shifts the SgII immunoreactivity toward lighter fractions without affecting the synaptic vesicle protein synaptophysin. *, P < 0.05 relative to control by two-tailed Student’s t test (n = 3 transfections). (B) PC12 cells were cotransfected with ANF-GFP and either AP-3 or control siRNA, and the postnuclear supernatant was sedimented as in A. In this case, however, ∼80 fractions were collected from the top of the gradient directly into a 96-well plate, and the fluorescence of ANF-GFP was measured directly using a plate reader. The graph indicates ANF-GFP fluorescence for each fraction expressed as a percentage of total gradient fluorescence. (right) The bar graph shows the area under the curve for the LDCV peak (black line), expressed as a percentage of total area. *, P < 0.01 relative to control by two-tailed Student’s t test (n = 3 transfections). (C and D) PC12 cells were transfected twice with either control or AP-3 siRNA and processed for electron microscopy 2 d after the second transfection. (C) Low magnification electron micrographs show a large reduction in the number of LDCVs (arrowheads) of cells transfected with AP-3 siRNA (right) relative to controls (left). Bar graphs indicate the number of LDCVs per cell in the section (left) and LDCV density (right). *, P < 0.0005; **, P < 0.000001 (n = 20 cells/condition). (D) Higher magnification electron micrographs show that AP-3 RNAi increases the size of LDCVs. Bar graphs indicate the corrected diameters (left) and areas (right) of both the entire LDCV and the electron-dense core (Parsons et al., 1995). (bottom) The LDCV area is presented as a frequency histogram. *, P < 0.01 (n = 205–221 LDCVs/condition). Bars, 200 nm.
Figure 7.
Figure 7.
AP-3 RNAi diverts SgII to constitutive secretory vesicles budding from the TGN. (A and B) PC12 cells were transfected twice with 50 nM AP-3 or control siRNA, labeled for 5 min with 0.5–1 mCi/ml 35SO4, and either harvested directly (pulse [p]) or incubated at 37°C for 4 h (chase [c]) in complete medium containing 1.6 mM nonradioactive Na2SO4. (A) Separation of duplicate cell extracts by electrophoresis followed by autoradiography shows that after 4 h, control cells store almost all of the labeled SgII. In contrast, AP-3 RNAi dramatically reduces the storage of SgII with no effect on the constitutively secreted HSPG. Error bars indicate the percent decline in cellular content of labeled protein after the chase relative to just after the pulse. *, P < 0.02 relative to control by two-tailed Student’s t test (n = 3). (B) Aliquots of media from the times indicated confirm the constitutive secretion of HSPG unaffected by AP-3 RNAi and the constitutive release of SgII produced by AP-3 RNAi. (C) PC12 were transfected and labeled with 35SO4 as described in A, incubated at 37°C for 15 min after the pulse, and a postnuclear supernatant separated by velocity sedimentation through a 0.3–1.2 M continuous sucrose gradient, with the TGN-derived vesicles in fractions 1–5 separated further by equilibrium sedimentation on a 0.5–2 M continuous sucrose gradient. (left) 500 µl fractions were collected from the top of the gradient, and 50 µl aliquots were separated by electrophoresis followed by fluorography. (right) Only fractions with significant amounts of radioactivity are shown, and the labeled HSPG and SgII in each fraction are expressed as a percentage of the total labeled protein on the gradient. The amount of SgII in the HSPG peak increases with AP-3 RNAi, and the bar graph indicates the area under the HSPG peak as a percentage of the area under the entire SgII curve (inset). *, P < 0.05 relative to control by two-tailed Student’s t test. The data indicate means of three independent transfections, and error bars indicate SEM.
Figure 8.
Figure 8.
AP-3 RNAi affects the membrane composition of LDCVs. PC12 cells were transfected twice with 50 nM AP-3δ or control siRNA, and the postnuclear supernatant obtained 2–3 d after the second transfection separated by equilibrium sedimentation through 0.6–1.6 M sucrose. (A) Fractions were collected from the top of the gradient and assayed for VAMP2, VAMP3, and synaptotagmin 1 (syt1) by quantitative fluorescent immunoblotting. (B) The amounts in each fraction in light membranes (peak I) and LDCV fractions (peak II) are expressed as a percentage of total gradient immunoreactivity. AP-3 RNAi greatly reduces the LDCV peak of synaptotagmin 1 and shifts the synaptotagmin 1 immunoreactivity toward lighter fractions. *, P < 0.05 relative to control by two-tailed Student’s t test (n = 3 transfections). Error bars indicate SEM.

References

    1. Arvan P., Castle D. 1998. Sorting and storage during secretory granule biogenesis: looking backward and looking forward. Biochem. J. 332:593–610 - PMC - PubMed
    1. Baeuerle P.A., Huttner W.B. 1987. Tyrosine sulfation is a trans-Golgi-specific protein modification. J. Cell Biol. 105:2655–2664 10.1083/jcb.105.6.2655 - DOI - PMC - PubMed
    1. Bard F., Casano L., Mallabiabarrena A., Wallace E., Saito K., Kitayama H., Guizzunti G., Hu Y., Wendler F., Dasgupta R., et al. 2006. Functional genomics reveals genes involved in protein secretion and Golgi organization. Nature. 439:604–607 10.1038/nature04377 - DOI - PubMed
    1. Berwin B., Floor E., Martin T.F. 1998. CAPS (mammalian UNC-31) protein localizes to membranes involved in dense-core vesicle exocytosis. Neuron. 21:137–145 10.1016/S0896-6273(00)80521-8 - DOI - PubMed
    1. Blagoveshchenskaya A.D., Hewitt E.W., Cutler D.F. 1999. Di-leucine signals mediate targeting of tyrosinase and synaptotagmin to synaptic-like microvesicles within PC12 cells. Mol. Biol. Cell. 10:3979–3990 - PMC - PubMed

Publication types