. 2010 Dec 28;107(52):22517-22.
doi: 10.1073/pnas.1012820107. Epub 2010 Dec 13.

Structural space of protein-protein interfaces is degenerate, close to complete, and highly connected

Affiliations

Structural space of protein-protein interfaces is degenerate, close to complete, and highly connected

Mu Gao et al. Proc Natl Acad Sci U S A. .

Abstract

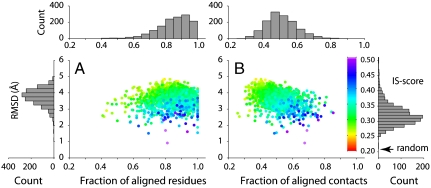
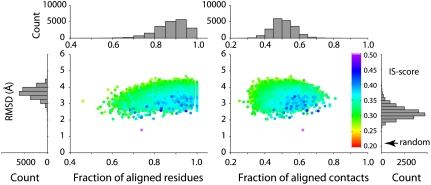
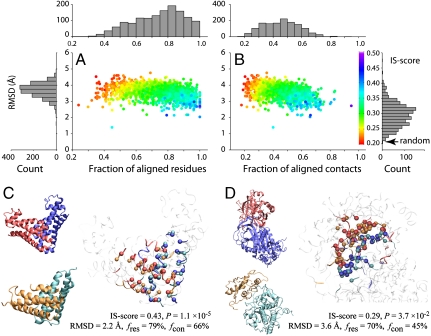
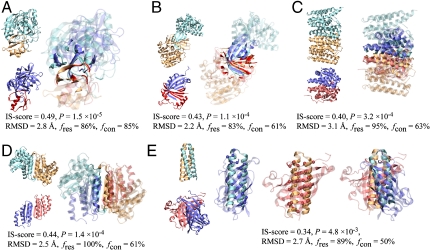
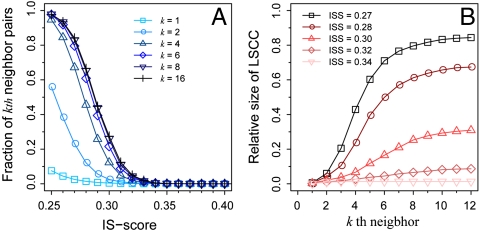
At the heart of protein-protein interactions are protein-protein interfaces where the direct physical interactions occur. By developing and applying an efficient structural alignment method, we study the structural similarity of representative protein-protein interfaces involving interactions between dimers. Even without structural similarity between individual monomers that form dimeric complexes, ∼90% of native interfaces have a close structural neighbor with similar backbone C(α) geometry and interfacial contact pattern. About 80% of the interfaces form a dense network, where any two interfaces are structurally related using a transitive set of at most seven intermediate interfaces. The degeneracy of interface space is largely due to the packing of compact, hydrogen-bonded secondary structure elements. This packing generates relatively flat interacting surfaces whose geometries are highly degenerate. Comparative study of artificial and native interfaces argues that the library of protein interfaces is close to complete and comprised of roughly 1,000 distinct interface types. In contrast, the number of possible quaternary structures of dimers is estimated to be about 10(4) times larger; thus, an experimentally determined database of all representative quaternary structures is not likely in the near future. Nevertheless, one could in principle exploit the completeness of protein interfaces to predict most dimeric quaternary structures. Finally, our results provide a structural explanation for the prevalence of promiscuous protein interactions. By side-chain packing adjustments, we illustrate how multiprotein specificity can be attained at a promiscuous interface.


Conflict of interest statement

The authors declare no conflict of interest.

Figures

Fig. 1.
Fig. 1.
Closest match to the representative set of 1,374 protein–protein interfaces, with rmsd scatter plots of residues aligned between two interfaces versus (A) fraction of aligned residues fres and (B) fraction of aligned contacts fcon. Each point is color-coded according to interface similarity measured by the IS-score. Histograms of rmsd, fres, fcon, and IS-score are shown in bar plots surrounding the scatter plots. The mean IS-score of best random interface alignments is indicated by an arrow in the IS-score histogram. The same scheme is employed in Figs. 3 and 4.
Fig. 4.
Fig. 4.
Closest matches found in the native interface set PDB150 to each of the 20,000 artificial protein–protein interface models.
Fig. 3.
Fig. 3.
The closest matching artificial interface to each of the native interfaces from PDB150. Scatter plots of rmsd for interfacial residues aligned between two interfaces versus (A) fraction of aligned residues fres and (B) fraction of aligned contacts fcon. Each point is color-coded according to the IS-score. Histograms of rmsd, fres, and fcon are shown in bar plots. Two examples are shown: (C) HI0074 (PDB and chain IDs: 1jog_AB), where the monomer structures of the artificial and real structures are similar, and (D) thrombin/antithrombin (1tb6_HI), where the closest monomer structures are dissimilar. The experimental and model complexes are shown in blue/red and cyan/orange, respectively. The Right snapshot shows the optimal interface alignment reported by iAlign; the Cα atoms of aligned residues are shown in a Van der Waals representation, and the noninterface regions are dimmed.
Fig. 2.
Fig. 2.
Examples of similar protein–protein interface pairs identified by iAlign. Coordinates of structures were taken from the PDB. The template (cyan/orange) and target (blue/red) proteins are (A) subtilisin BPN/chymotypsin inhibitor 2 (PDB code and chain IDs: 1tm7_EI) and streptogrisin B/ovomucoid inhibitor (1sgy_EI), (B) ribokinase (1vm7_AB) and heme-degrading enzyme PC130 (1sqe_AB), (C) farnesyl pyrophosphate synthetase (1rtr_AB) and HemAT (1or6_AB), (D) aspartate racemase (1jfl_AB) and DCoH (1dcp_EF), and (E) Rop (1f4m_CD) and allene oxide cyclase (1z8k_AC). In E, interfacial alignments are illustrated separately for each side of the interface; and the Cα atoms of aligned residues are represented in spheres. For clarity, interface/noninterface regions are shown in solid/transparent colors, respectively. Molecular images were created with VMD (32).
Fig. 5.
Fig. 5.
Connectivity of the structural space of interfaces. (A) The fraction of at most kth neighbor pairs of interfaces versus IS-score (ISS). The fraction is calculated as nk/[N(N - 1)], where nk is the number of kth neighbor pairs and N is the total number of interfaces (nodes). (B) The relative size of the LSCC at different kth neighbor cutoffs.
Fig. 6.
Fig. 6.
Interface comparison between a histone H3 dimer and an Asf1/H3 complex. Cartoon representations of (A) histone H3s (mauve/green, 1tzy_CG) and (B) Asf1/H3 (orange/cyan, 2hue_AB). (C) The optimal interface alignment between two complexes. The Cα atoms of aligned residues are shown in spheres, and the interface/noninterface regions are shown in a solid/transparent ribbon representation. (D) Val92Asf1 and His133H3 (ball-and-stick representations) are two aligned residues that contact the same set of interfacial residues (licorice representation, color-coded by residue type) from the opposite H3 molecule. Movements of side chains of D123 and L126 in two complexes are indicated by black arrows. Surface representations of opposite interfacial residues in contact with (E) Val92Asf1 and (F) His133H3.

References

    1. Nooren IMA, Thornton JM. Diversity of protein–protein interactions. EMBO J. 2003;22(14):3486–3492. - PMC - PubMed
    1. Russell RB, et al. A structural perspective on protein–protein interactions. Curr Opin Struct Biol. 2004;14:313–324. - PubMed
    1. Janin J, Bahadur RP, Chakrabarti P. Protein–protein interaction and quaternary structure. Q Rev Biophys. 2008;41:133–180. - PubMed
    1. Jones S, Thornton JM. Principles of protein–protein interactions. Proc Natl Acad Sci USA. 1996;93:13–20. - PMC - PubMed
    1. Keskin Z, Gursoy A, Ma B, Nussinov R. Principles of protein–protein interactions: What are the preferred ways for proteins to interact? Chem Rev. 2008;108:1225–1244. - PubMed

Publication types

LinkOut - more resources