. 2010 Dec 28;107(52):22617-22.
doi: 10.1073/pnas.1009152108. Epub 2010 Dec 13.

IL-4/STAT6 immune axis regulates peripheral nutrient metabolism and insulin sensitivity

Affiliations

IL-4/STAT6 immune axis regulates peripheral nutrient metabolism and insulin sensitivity

Roberto R Ricardo-Gonzalez et al. Proc Natl Acad Sci U S A. .

Abstract

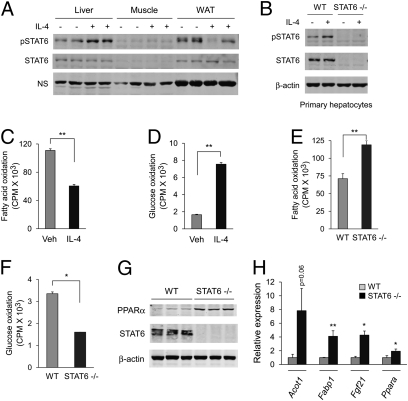
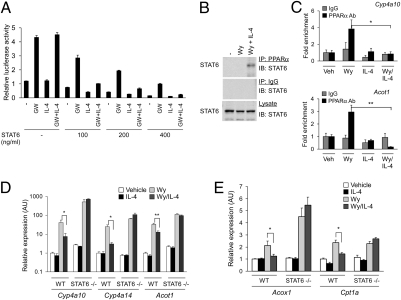
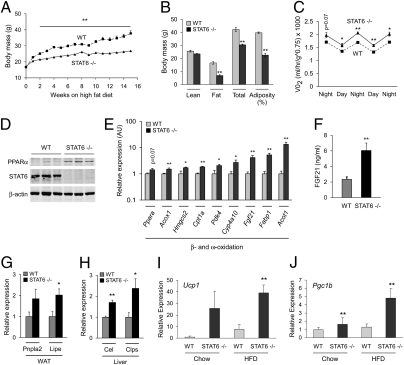
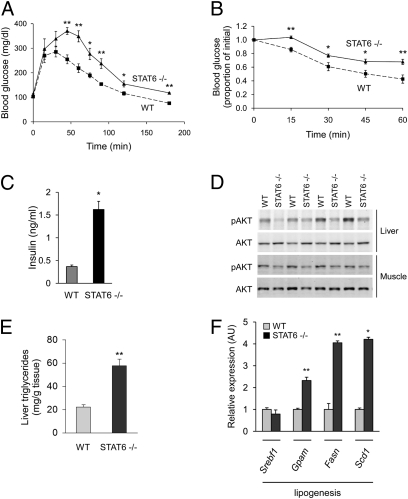
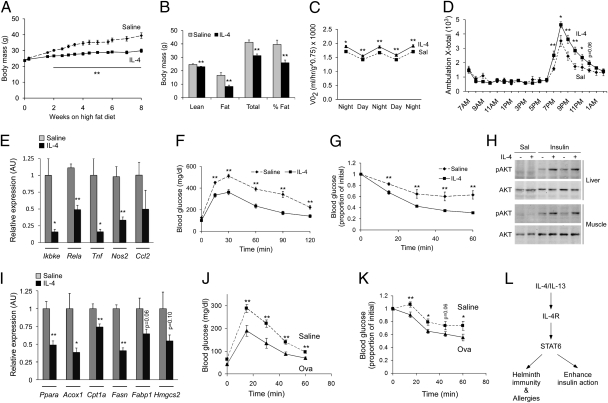
Immune cells take residence in metabolic tissues, providing a framework for direct regulation of nutrient metabolism. Despite conservation of this anatomic relationship through evolution, the signals and mechanisms by which the immune system regulates nutrient homeostasis and insulin action remain poorly understood. Here, we demonstrate that the IL-4/STAT6 immune axis, a key pathway in helminth immunity and allergies, controls peripheral nutrient metabolism and insulin sensitivity. Disruption of signal transducer and activator of transcription 6 (STAT6) decreases insulin action and enhances a peroxisome proliferator-activated receptor α (PPARα) driven program of oxidative metabolism. Conversely, activation of STAT6 by IL-4 improves insulin action by inhibiting the PPARα-regulated program of nutrient catabolism and attenuating adipose tissue inflammation. These findings have thus identified an unexpected molecular link between the immune system and macronutrient metabolism, suggesting perhaps the coevolution of these pathways occurred to ensure access to glucose during times of helminth infection.


Conflict of interest statement

The authors declare no conflict of interest.

Figures

Fig. 1.
Fig. 1.
IL-4 and STAT6 regulate liver nutrient metabolism. (A) IL-4 enhances phosphorylation of STAT6 in the liver, but not skeletal muscle or WAT. NS, nonspecific. (B) STAT6 is expressed in primary hepatocytes and becomes tyrosine-phosphorylated in response to IL-4. (C and D) IL-4 regulates macronutrient metabolism in isolated primary hepatocytes. Changes in rates of fatty acid (C) and glucose oxidation (D) in hepatocytes treated with IL-4 (10 ng/mL). (E and F) STAT6 regulates fuel oxidation in primary hepatocytes. Rates of fatty acid (E) and glucose oxidation (F) in wild-type and STAT6-null hepatocytes. (G and H) Induction of PPARα and its transcriptional program in livers of STAT6−/− mice. (G) Immunoblotting for PPARα and STAT6 in wild-type and STAT6-null livers. β-actin is used as a loading control. (H) Quantitative RT-PCR analyses for PPARα and its target genes, acyl-CoA thioesterase 1 (Acot1), fatty-acid binding protein 1 (Fabp1), and fibroblast growth factor 21 (Fgf21), in livers of wild-type and STAT6−/− mice. All results are displayed as means ± SEM n > 3. *P < 0.05; **P < 0.01.
Fig. 2.
Fig. 2.
IL-4 and STAT6 inhibit PPARα transcriptional activity. (A) Suppression of PPARα transcriptional activity by STAT6 and IL-4. CV-1 cells were transfected with reporter plasmid (PPRE3-tk-Luc, 100 ng) and expression plasmids for PPARα (25 ng) and STAT6 (varying amounts). (B) Coimmunoprecipitation of STAT6 and PPARα. Liver lysates from treated animals were immunoprecipitated with anti-PPARα antibody and immunoblotted for STAT6. (C) ChIP analysis of PPARα target genes. Chromatin fragments were precipitated from hepatocytes treated with vehicle or Wy14643 (Wy) in the presence or absence of IL-4. Regions flanking the PPARα binding sites on Cyp4a10 and Acot1 promoters were amplified by qPCR and data were normalized to IgG control. (D and E) Activation of STAT6 by IL-4 represses PPARα transcriptional activity. Quantitative RT-PCR analyses of PPARα target genes in primary hepatocytes. Error bars are displayed as mean ± SEM (n = 3–4 for each mouse group). *P < 0.05; **P < 0.01.
Fig. 3.
Fig. 3.
Resistance to dietary obesity and increased energy expenditure in STAT6-null mice. (A) Wild-type and STAT6−/− mice were placed on a HFD at 8 wk of age, and weight gain was monitored for 16 wk (n = 5 per genotype). (B) Dual-energy X-ray absorptiometry was used to determine body composition (n = 5 per genotype). (C) Indirect calorimetry was used to determine VO2 consumption in wild-type and STAT6−/− mice. (D) Immunoblotting for PPARα and STAT6 proteins in livers of wild-type and STAT6-null mice after 16 wk of HFD. (E) Quantitative RT-PCR analyses of total liver RNA from wild-type and STAT6−/− mice. Note induction of signature genes for β- and ω-oxidation in livers of STAT6−/− mice. (F) Serum Fgf21 levels were quantified by ELISA. (G and H) Quantitative RT-PCR analyses for adipose tissue and pancreatic lipases in WAT and liver of wild-type and STAT6−/− mice. Patatin-like phospholipase domain containing 2 (Pnpla2) and hormone sensitive lipase (Lipe) are expressed in WAT (G), whereas carboxyl ester lipase (Cel) and pancreatic colipase (Clps) are induced in liver (H). (I and J) Induction of uncoupled respiration in STAT6−/− WAT. Quantitative RT-PCR analyses for expression of Ucp1 (I) and Pgc1b (J) mRNAs in epididymal WAT of WT and STAT6−/− mice (n = 5 per genotype). Data presented as mean ± SEM. *P < 0.05; **P < 0.01.
Fig. 4.
Fig. 4.
Insulin action is decreased in STAT6-null mice. (A and B) Impaired glucose homeostasis in STAT6-null mice fed a HFD. Wild-type (dashed line) and STAT6-null (solid line) mice (8–10 wk old) were fed HFD for 8 to 10 wk (n = 5 per genotype). Increased glucose intolerance (A) and insulin resistance (B), as assessed by intraperitoneal glucose tolerance test (2 g/kg) and insulin-tolerance test (0.75 U/kg). (C) Serum insulin levels were quantified by ELISA. (D) Decreased insulin signaling in STAT6−/− mice, as assessed by quantification of phospho-AKT. (E) Increased hepatic triglycerides in STAT6−/− mice (n = 5). (F) Induction of lipogenic gene expression in livers of STAT6−/− mice. All transcripts were measured by qRT-PCR (n = 5). Data presented as mean ± SEM. *P < 0.05; **P < 0.01.
Fig. 5.
Fig. 5.
IL-4 and Th2 polarization improve glucose homeostasis in mice maintained on a HFD. (A and B) IL-4 treatment protects from diet-induced obesity. Total weight gain (A) and DEXA assessment of adiposity (B). Eight-week-old C57BL/6J mice (n = 6–8 per group) were placed on a HFD for 8 wk, and concurrently treated with saline (dashed line) or IL-4 (solid line). (C and D) Indirect calorimetry measurement of VO2 consumption (C) and locomotor activity (D) (n = 6 per treatment group). (E) Quantification of inflammatory genes in WAT of saline- or IL-4–treated mice by qRT-PCR (n = 6–8 per group). (F–H) IL-4 treatment improves glucose homeostasis. Glucose tolerance (F), insulin tolerance (G), and insulin signaling (H) was assessed in saline and IL-4–treated C57BL/6J mice (n = 6–8 per treatment group). (I) IL-4 treatment suppresses expression of PPARα and its target genes in liver. (J and K) OVA-induced Th2 polarization improves glucose tolerance (J) and insulin sensitivity (K) in D011.10 mice. Eight- to 10-wk-old D011.10 mice maintained on HFD were treated with saline (dashed line) or OVA with aluminum hydroxide (solid line) for 8 wk (n = 5 per group). (L) Model of IL-4/STAT6 functions in immunity, nutrient metabolism and longevity. Data presented as mean ± SEM. *P < 0.05; **P < 0.01.

Comment in

References

    1. Akira S, Uematsu S, Takeuchi O. Pathogen recognition and innate immunity. Cell. 2006;124:783–801. - PubMed
    1. Medzhitov R. Approaching the asymptote: 20 years later. Immunity. 2009;30:766–775. - PubMed
    1. Cramer T, Johnson RS. A novel role for the hypoxia inducible transcription factor HIF-1alpha: Critical regulation of inflammatory cell function. Cell Cycle. 2003;2:192–193. - PubMed
    1. Kellett DN. 2-Deoxyglucose and inflammation. J Pharm Pharmacol. 1966;18:199–200. - PubMed
    1. Fox CJ, Hammerman PS, Thompson CB. Fuel feeds function: Energy metabolism and the T-cell response. Nat Rev Immunol. 2005;5:844–852. - PubMed

Publication types

MeSH terms